Fig. 2.
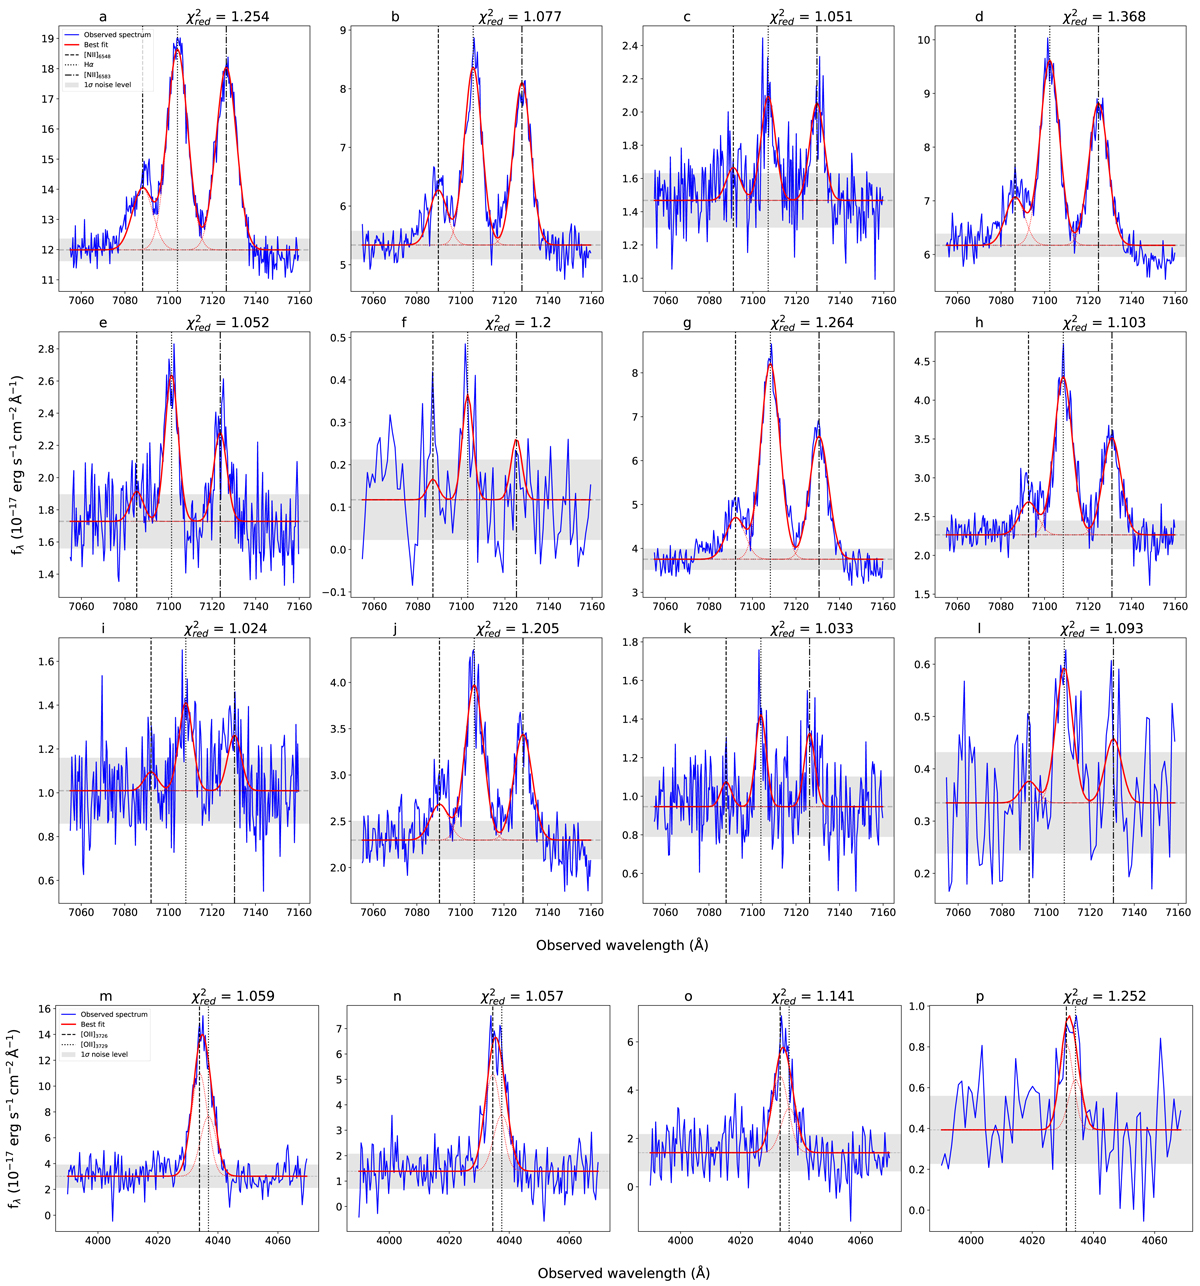
Zoom on the wavelength range of interest for the 16 spectra extracted in this work (12 Hα spectra in the top three rows and 4 [O II] spectra in the fourth row). The solid red curve is the best fit along with its decomposition in single lines shown as thin red dotted lines. The gray dashed line and shaded region indicates the continuum level obtained from the fitting with the 1σ noise level. The black dashed, dotted, and dot-dashed vertical lines indicate the positions of the [N II]6548, Hα and [N II]6583 emission lines, respectively, for the three top rows. The dashed and dotted lines in the bottom row show the position of the two components of the [OII] doublet. The region name and the reduced χ2 are indicated on top of the each panel.
Current usage metrics show cumulative count of Article Views (full-text article views including HTML views, PDF and ePub downloads, according to the available data) and Abstracts Views on Vision4Press platform.
Data correspond to usage on the plateform after 2015. The current usage metrics is available 48-96 hours after online publication and is updated daily on week days.
Initial download of the metrics may take a while.