Fig. 1.
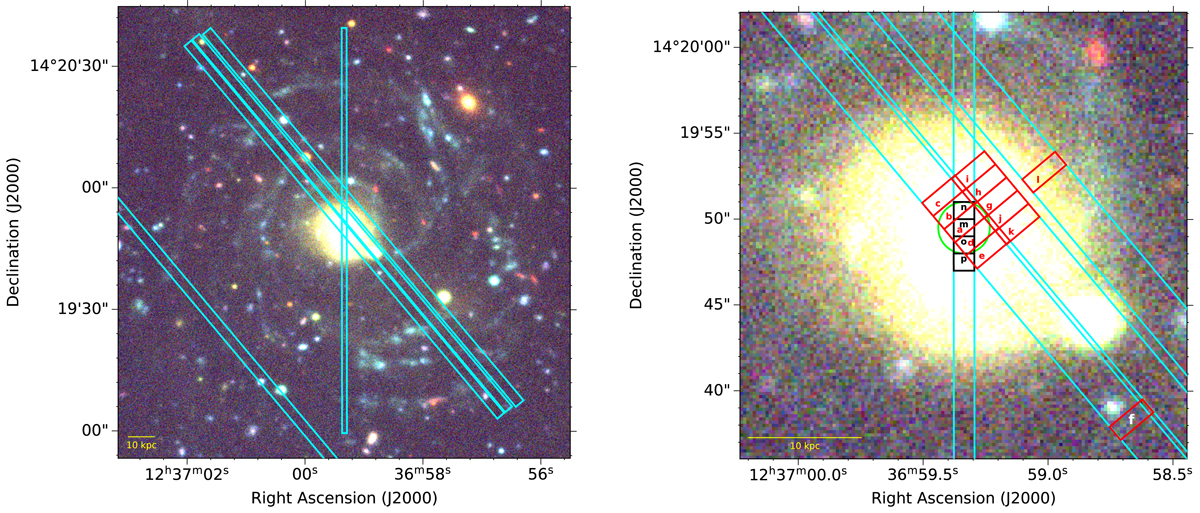
Left: colour composite image of Malin 1 from the CFHT-Megacam NGVS (Ferrarese et al. 2012) u, g, and i band images. The slit positions of our observations are shown as blue rectangles. Right: positions of the 16 apertures in which we could extract a spectrum. The 2016 and 2019 observations are denoted as red and black regions, respectively, along with their designated region names (see Tables 2 and 3). The green circular region indicated in the centre is the location of a SDSS spectrum of Malin 1 with an aperture of 3″ diameter.
Current usage metrics show cumulative count of Article Views (full-text article views including HTML views, PDF and ePub downloads, according to the available data) and Abstracts Views on Vision4Press platform.
Data correspond to usage on the plateform after 2015. The current usage metrics is available 48-96 hours after online publication and is updated daily on week days.
Initial download of the metrics may take a while.