Fig. 8
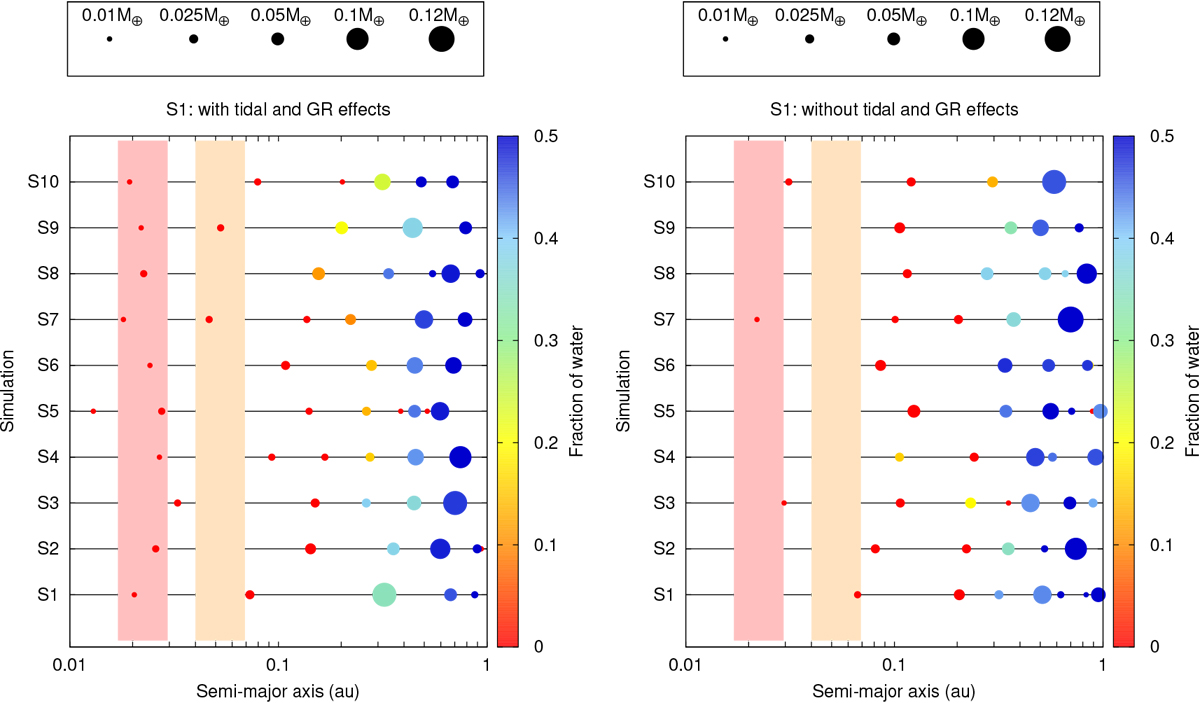
Distribution of the resulting planet locations in the region of study in each simulation for scenario S1. Planets were distinguished by mass and fraction of water in mass. The masses of the resulting planets are shown at the top of each graphic. The range is between 0.01 M⊕ and 0.12 M⊕ (this is approximately the mass of the Moon and Mars, respectively). The fraction of water in mass is presented in color-scale and is assigned to each body as a percentage between 0.01 and 50%. Left panel: resulting planets from simulations in which tidal and GR effects are included during the integration time. Right panel:planets from simulations that neglected these effects. The cream band represent the IHZ at 100 Myr, and the pink band shows the IHZ at 1 Gyr.
Current usage metrics show cumulative count of Article Views (full-text article views including HTML views, PDF and ePub downloads, according to the available data) and Abstracts Views on Vision4Press platform.
Data correspond to usage on the plateform after 2015. The current usage metrics is available 48-96 hours after online publication and is updated daily on week days.
Initial download of the metrics may take a while.