Free Access
Fig. 7
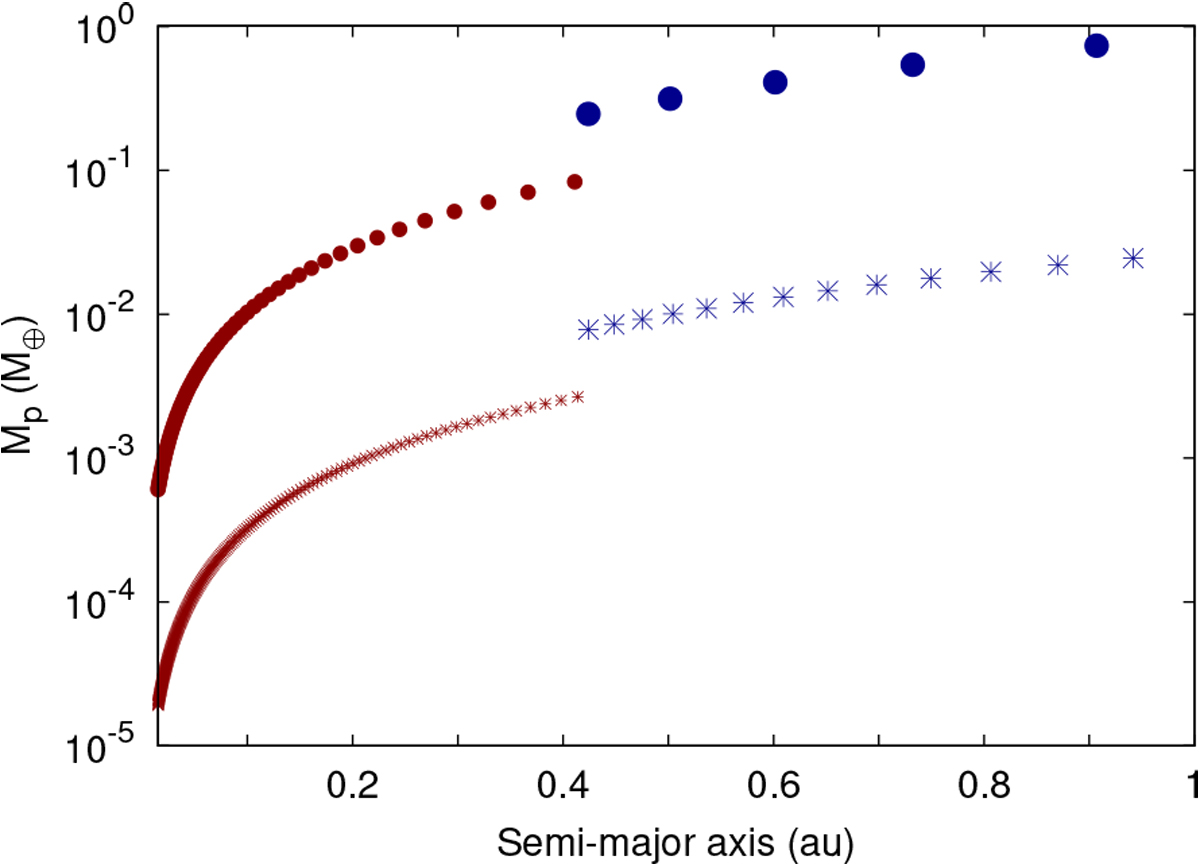
Initial embryo distributions of masses as a function of their initial location given by their semimajor axis for S1 (circles) and S2 (stars). Blue represents the water-rich population (50% water in mass), and red represents the bodies with the lowest amount of water in mass (0.01%).
Current usage metrics show cumulative count of Article Views (full-text article views including HTML views, PDF and ePub downloads, according to the available data) and Abstracts Views on Vision4Press platform.
Data correspond to usage on the plateform after 2015. The current usage metrics is available 48-96 hours after online publication and is updated daily on week days.
Initial download of the metrics may take a while.