Free Access
Fig. 17
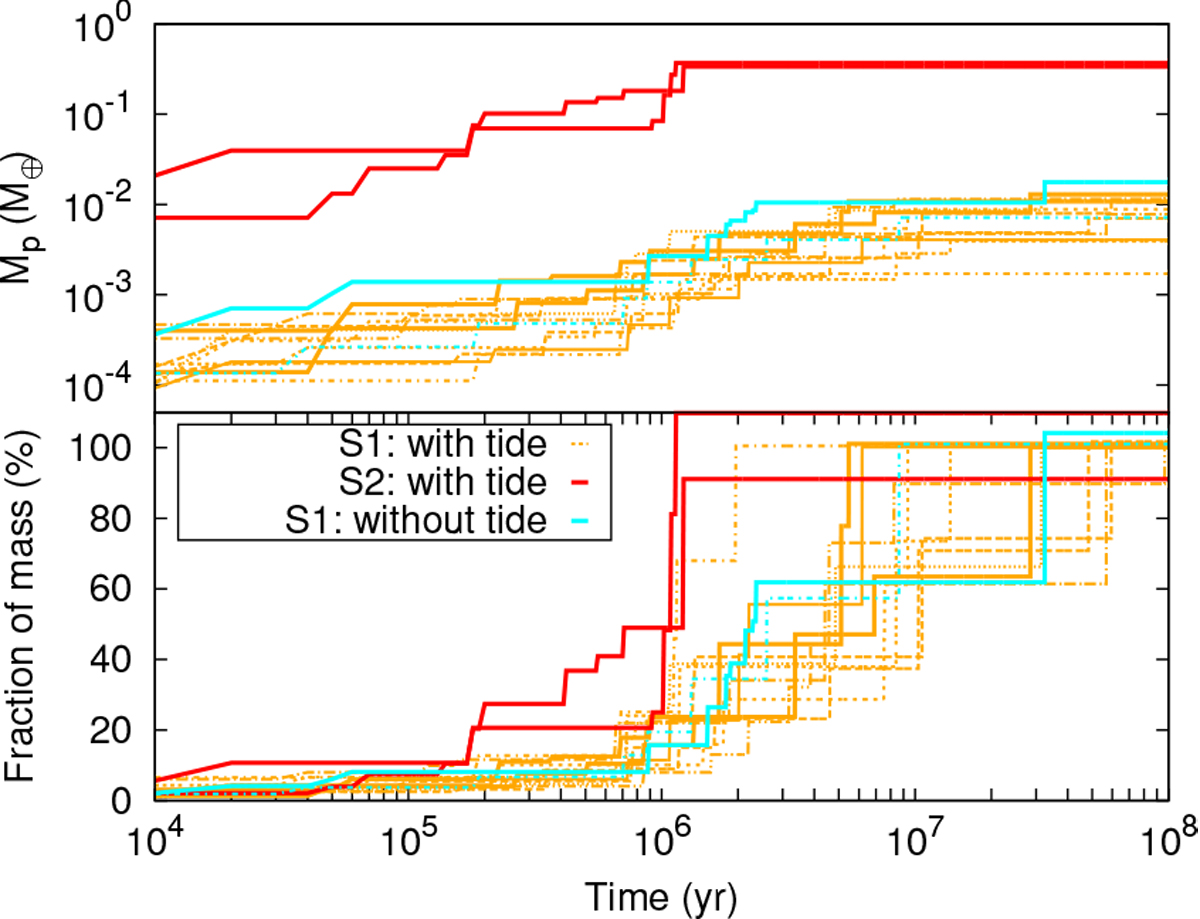
Evolution of the mass (top panel) and its fraction with respect to the final mass (bottom panel) of the resulting planets thatsurvived inside the IHZ at 100 Myr (solid lines) and 1 Gyr (dotted lines) in S1 with tide and GR (orange curves), in S2 without tide and GR (cyan curves), and in S2 with tide and GR (red curves).
Current usage metrics show cumulative count of Article Views (full-text article views including HTML views, PDF and ePub downloads, according to the available data) and Abstracts Views on Vision4Press platform.
Data correspond to usage on the plateform after 2015. The current usage metrics is available 48-96 hours after online publication and is updated daily on week days.
Initial download of the metrics may take a while.