Fig. 13
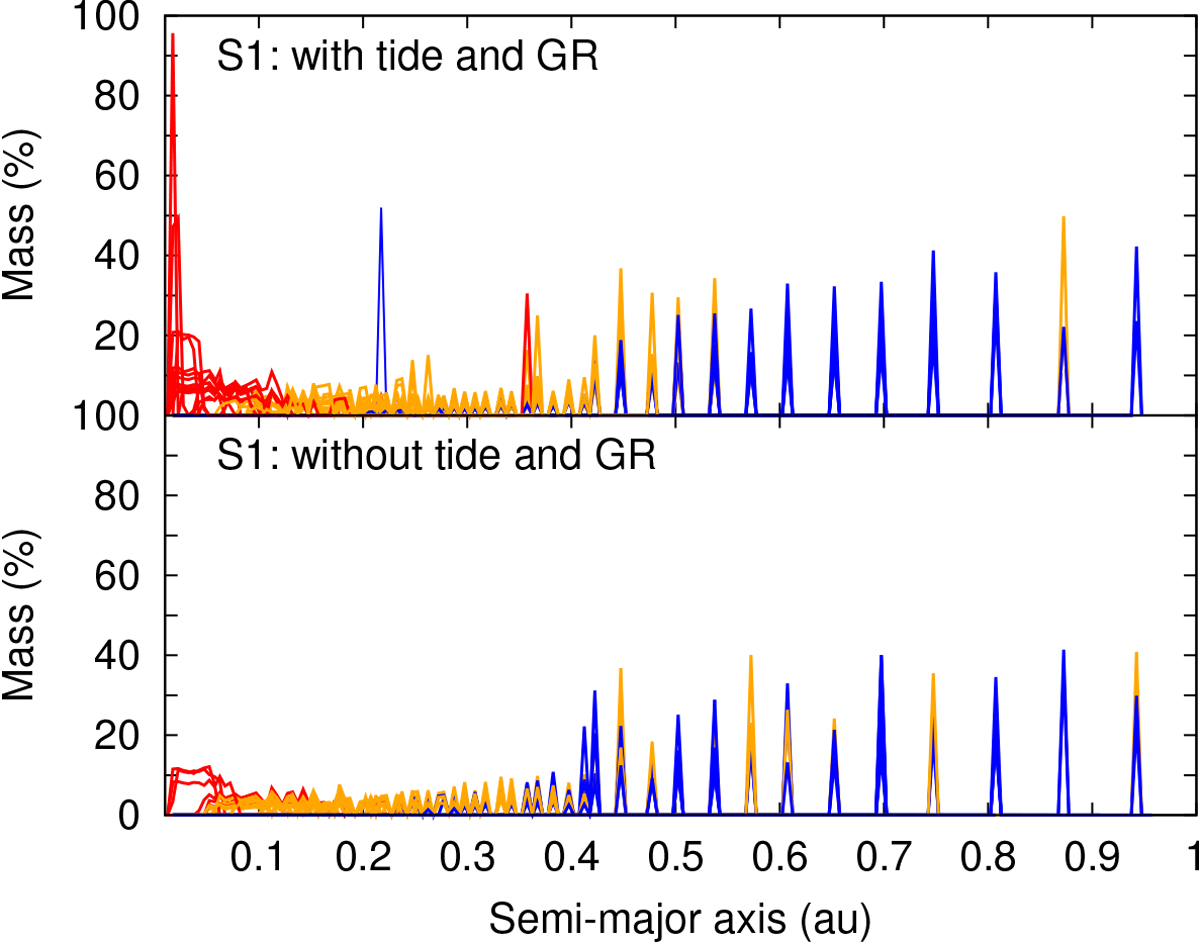
Collisional history of the resulting planets from the simulations in S1 in which tidal and GR effects are included (top panel) and in which these effects are neglected (bottom panel). Each jump in semimajor axis indicates the initial location of the embryo that collided with the resulting planets that increased their masses by a given percentage after the perfect merger. The red lines indicate the history of the resulting planets that are finally located at a < 0.1 au, the orange lines show planets located at 0.1 < a∕au < 0.42, and the blue lines represent planets located at 0.42 < a∕au < 1.
Current usage metrics show cumulative count of Article Views (full-text article views including HTML views, PDF and ePub downloads, according to the available data) and Abstracts Views on Vision4Press platform.
Data correspond to usage on the plateform after 2015. The current usage metrics is available 48-96 hours after online publication and is updated daily on week days.
Initial download of the metrics may take a while.