Fig. 11
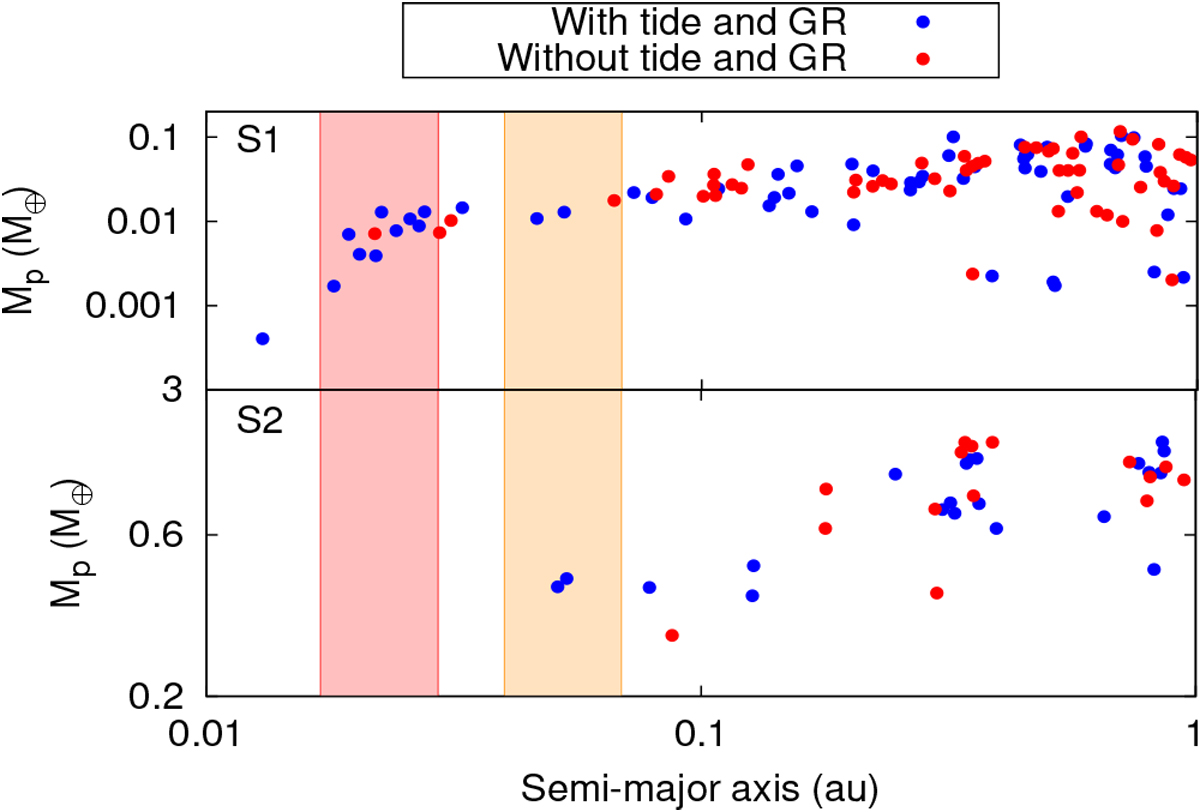
Distribution in mass of the resulting planets for their semimajor axis at 100 Myr in S1 (top panel) and S2 (bottom panel). Blue dots represent the planets from simulations that included tidal and GR effects, while red dots represent those from simulations that neglected these effects. The pink band represents the location of the IHZ at 1 Gyr, while the cream band represents its location at 100 Myr.
Current usage metrics show cumulative count of Article Views (full-text article views including HTML views, PDF and ePub downloads, according to the available data) and Abstracts Views on Vision4Press platform.
Data correspond to usage on the plateform after 2015. The current usage metrics is available 48-96 hours after online publication and is updated daily on week days.
Initial download of the metrics may take a while.