Free Access
Fig. 10
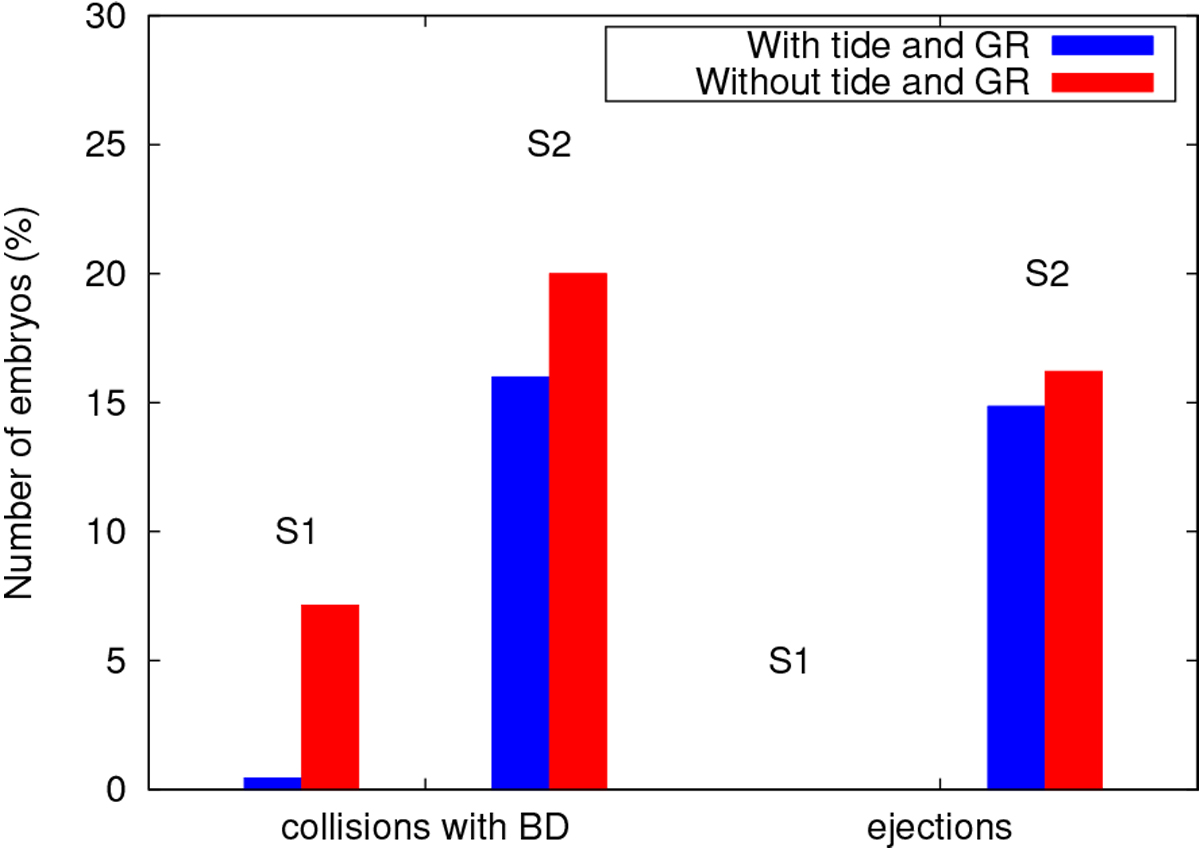
Percentage of embryos that collided or were ejected from the system during the integration time of each scenario. Blue bars correspond to embryos from simulations that included tidal and GR effects, and red bars represent embryos from simulations that neglected these effects.
Current usage metrics show cumulative count of Article Views (full-text article views including HTML views, PDF and ePub downloads, according to the available data) and Abstracts Views on Vision4Press platform.
Data correspond to usage on the plateform after 2015. The current usage metrics is available 48-96 hours after online publication and is updated daily on week days.
Initial download of the metrics may take a while.