Fig. 4.
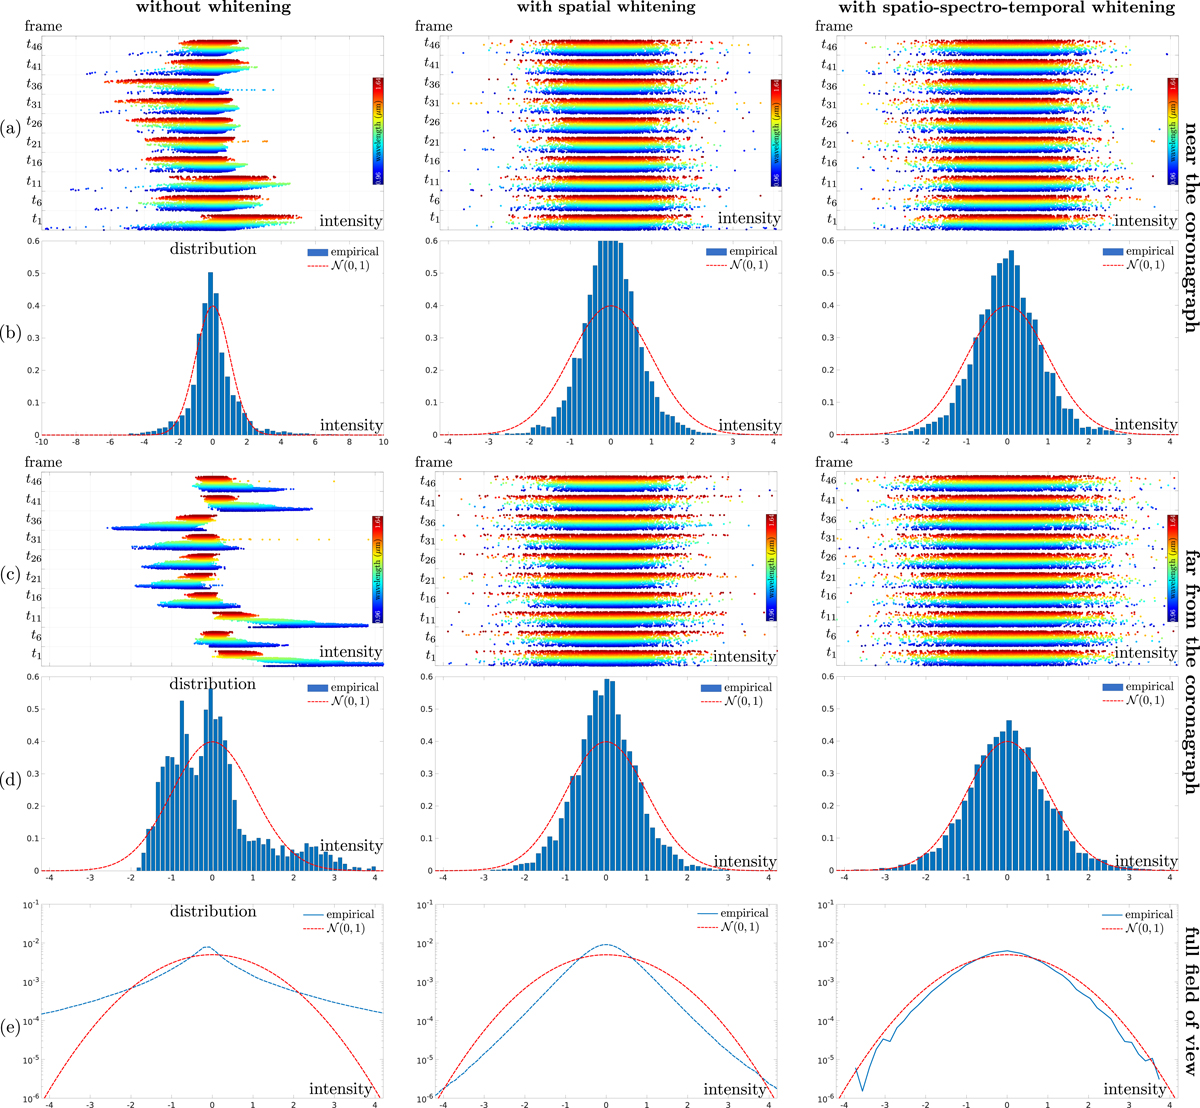
Distribution of the centered patches: left: without whitening; center: after spatial whitening; right: after spatial whitening and correction by the wavelength and time-specific scaling factors. Rows a and b: location selected at a small angular separation; rows c and d: location at a larger angular separation; row e: empirical distribution computed over the whole field of view. Patches represented in this figure contain no point-source.
Current usage metrics show cumulative count of Article Views (full-text article views including HTML views, PDF and ePub downloads, according to the available data) and Abstracts Views on Vision4Press platform.
Data correspond to usage on the plateform after 2015. The current usage metrics is available 48-96 hours after online publication and is updated daily on week days.
Initial download of the metrics may take a while.