Fig. D.1.
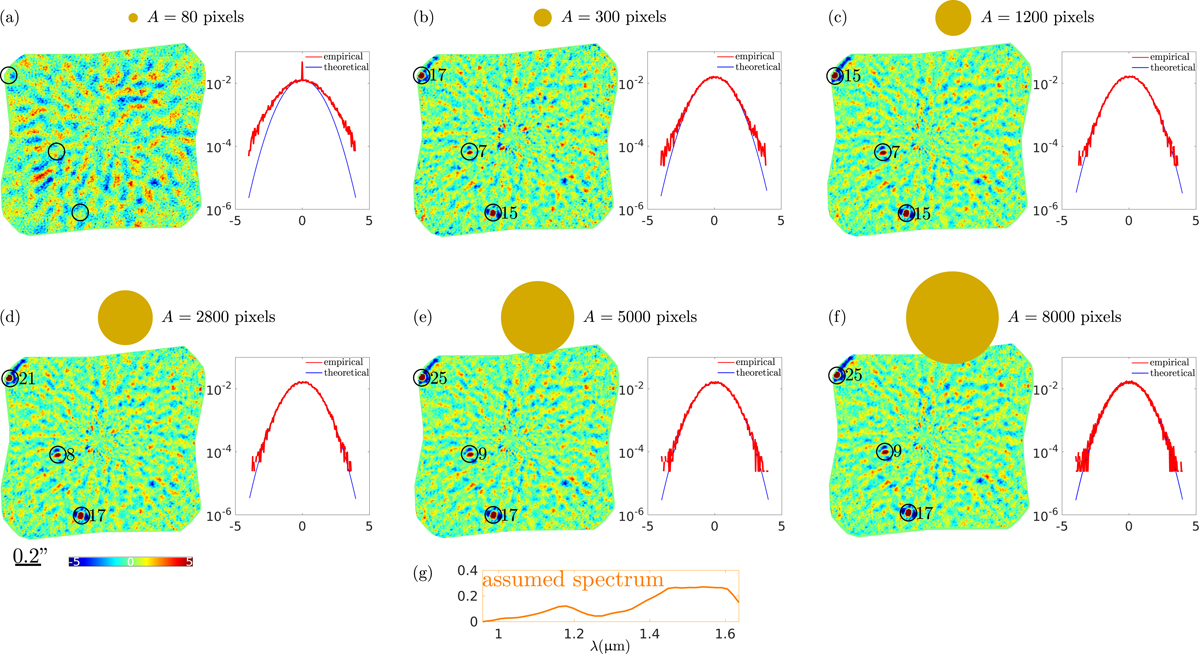
Influence of the size A (given in pixels and displayed as a disk at the scale of the field of view) of the region over which the spectral covariances ![]() are estimated. The S/Nℓ maps are combined assuming the spectrum shown in (g), for whitening matrices
are estimated. The S/Nℓ maps are combined assuming the spectrum shown in (g), for whitening matrices ![]() obtained from each estimate of the spectral covariance. From a to f: combined maps wwS/N and the empirical distribution of wwS/N under ℋ0 are shown side by side.
obtained from each estimate of the spectral covariance. From a to f: combined maps wwS/N and the empirical distribution of wwS/N under ℋ0 are shown side by side.
Current usage metrics show cumulative count of Article Views (full-text article views including HTML views, PDF and ePub downloads, according to the available data) and Abstracts Views on Vision4Press platform.
Data correspond to usage on the plateform after 2015. The current usage metrics is available 48-96 hours after online publication and is updated daily on week days.
Initial download of the metrics may take a while.