Fig. 17.
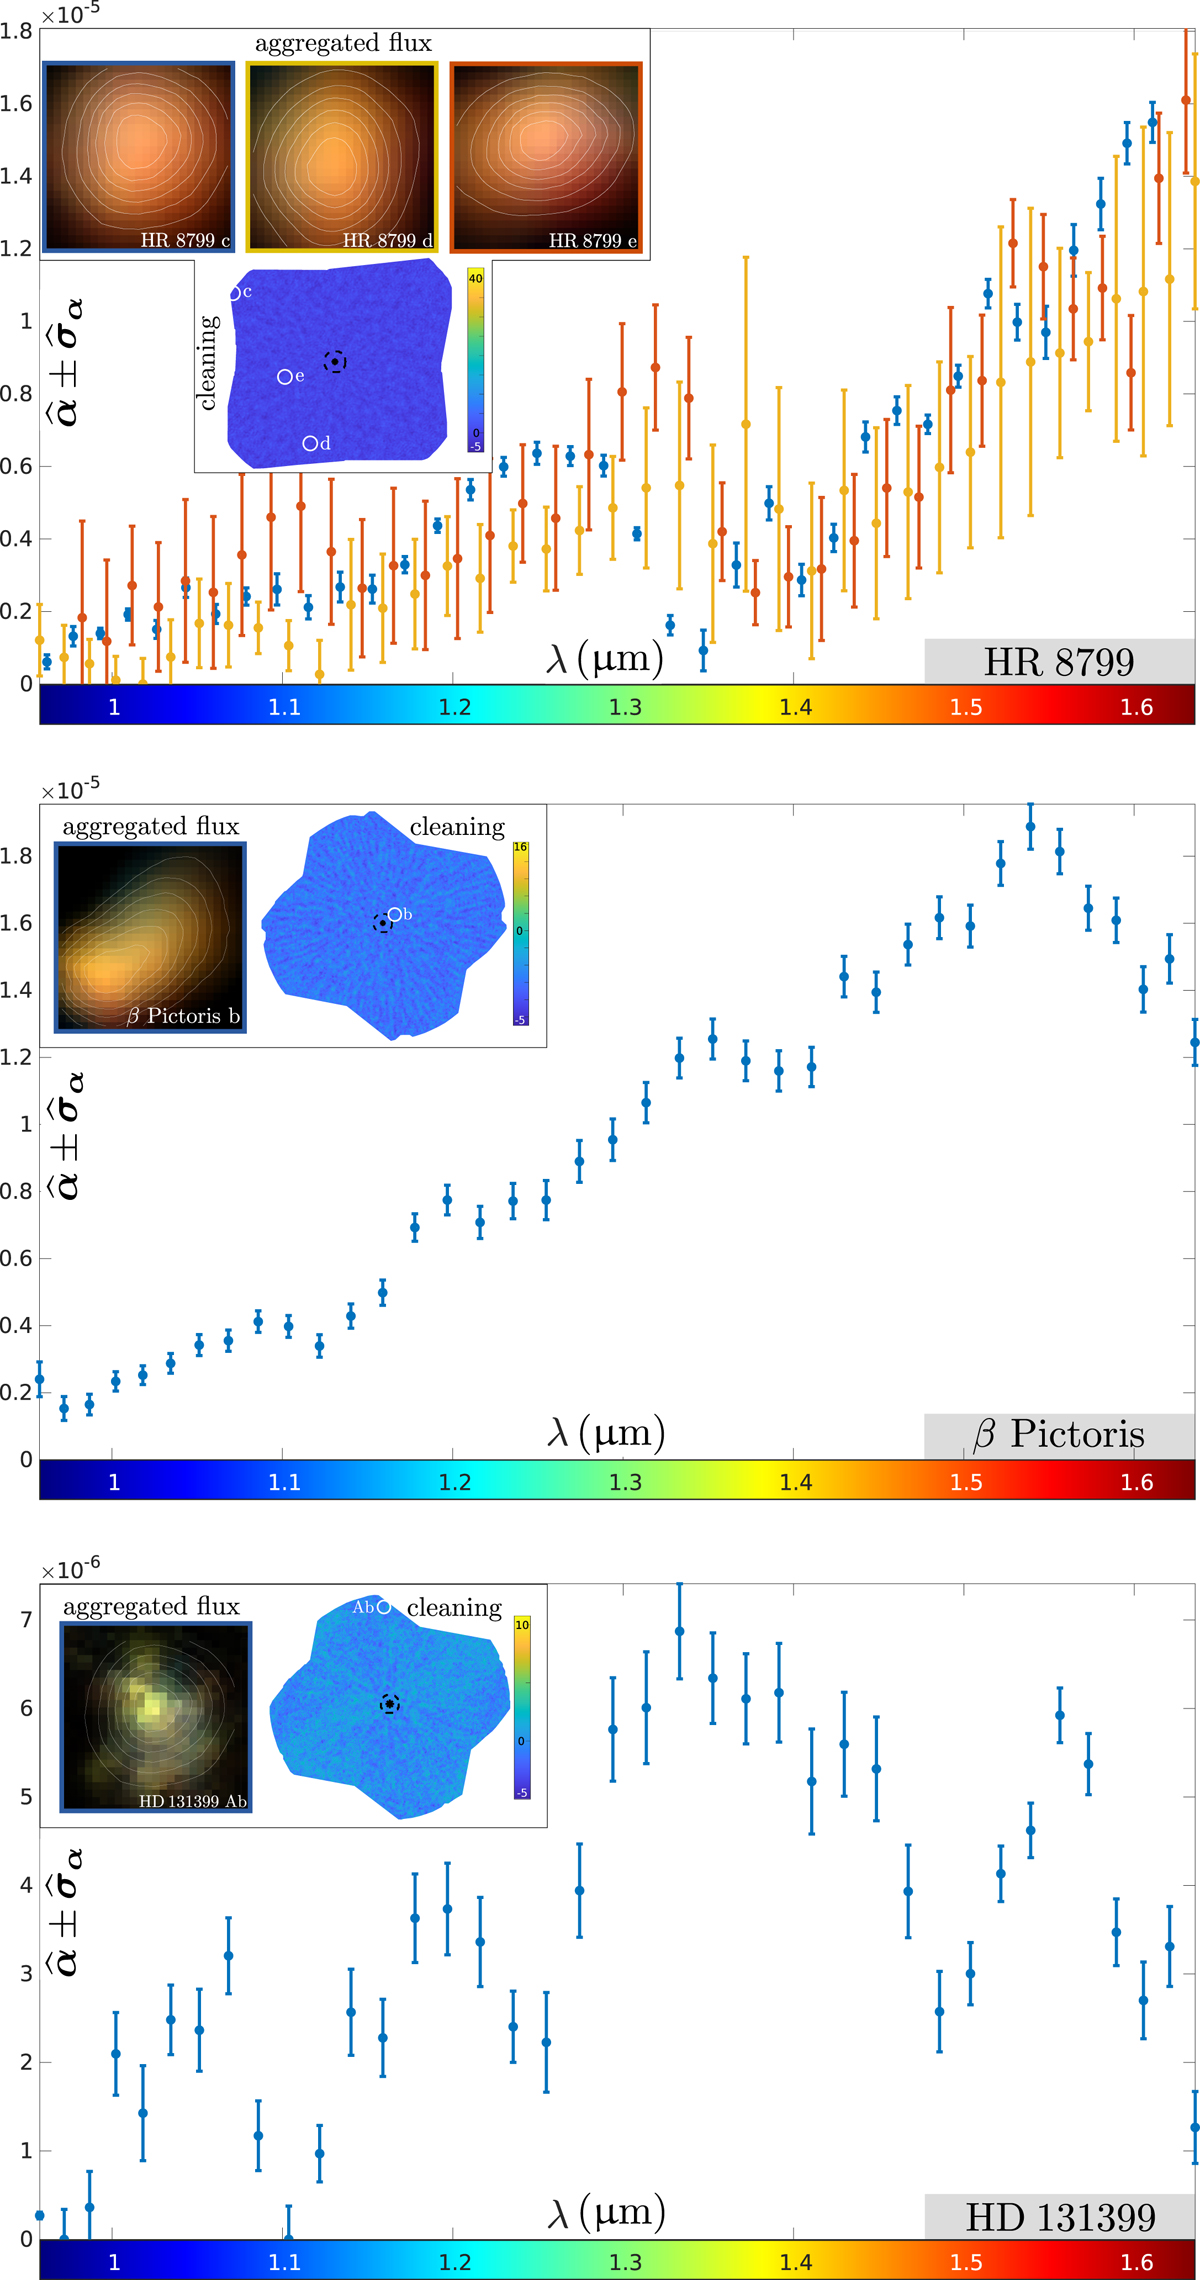
Estimated spectra using PACO ASDI of the known real faint point sources of the considered datasets (top: HR 8799 c–d–e, middle: β Pictoris b, bottom: HD 131399 Ab). The inserts show a residual wwS/N map after “cleaning” the contribution of the detected sources. Synthetic subpixel views (4 nodes per pixels) show with false colors the aggregated flux of the detected sources along the different spectral channels (blue for ℓ1 = 0.9575 μm and red for ℓL = 39 = 1.6357 μm).
Current usage metrics show cumulative count of Article Views (full-text article views including HTML views, PDF and ePub downloads, according to the available data) and Abstracts Views on Vision4Press platform.
Data correspond to usage on the plateform after 2015. The current usage metrics is available 48-96 hours after online publication and is updated daily on week days.
Initial download of the metrics may take a while.