Fig. 16.
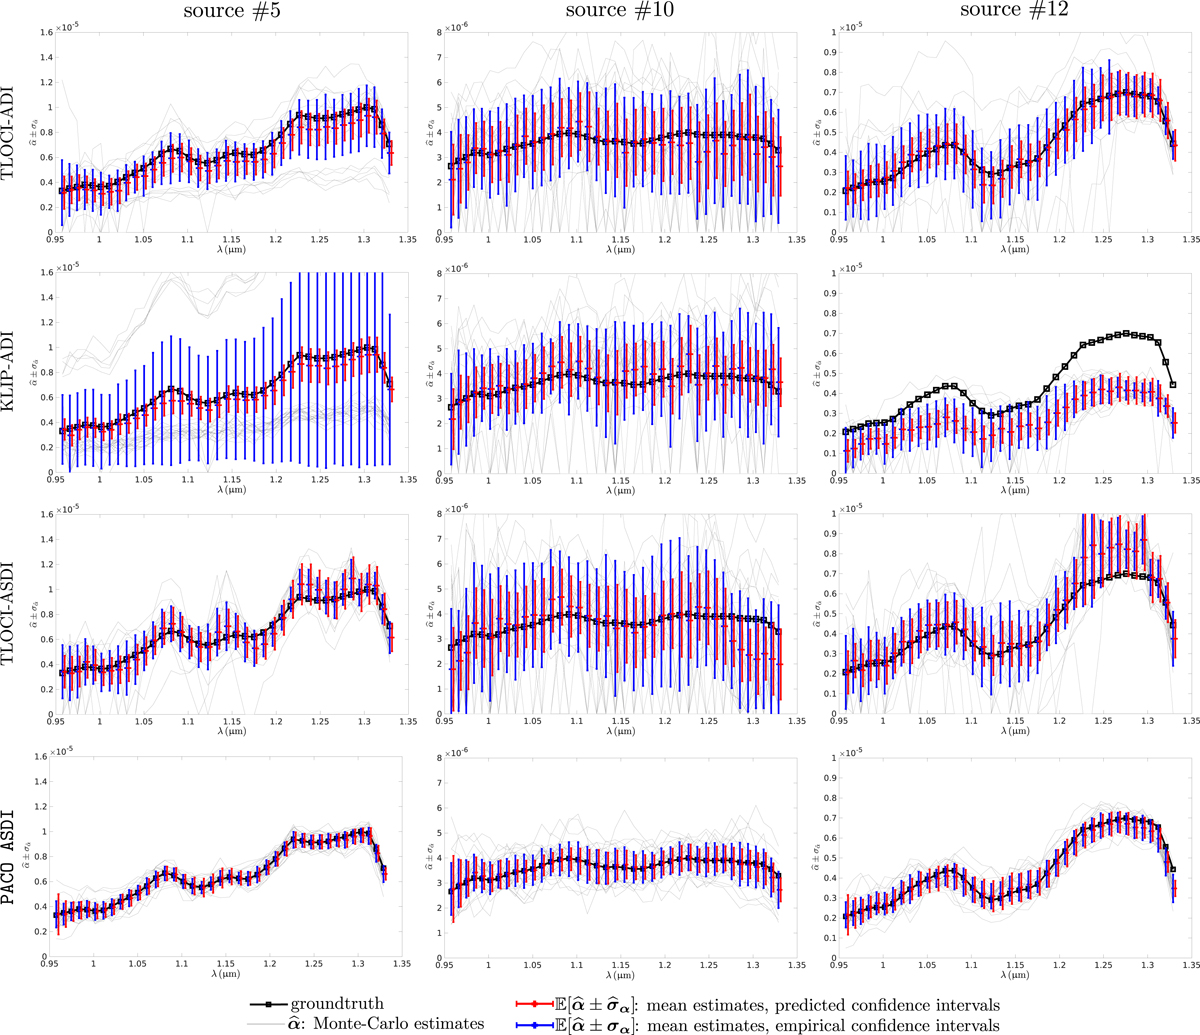
Monte–Carlo estimated spectrum for fake point sources #5, #10 and #12 obtained with TLOCI-ADI, KLIP-ADI (5 modes), TLOCI-ASDI and PACO ASDI. For each of the three considered sources, the 30 Monte–Carlo spectrum estimations are given in gray line. Red and blue lines compare the 1σ predicted confidence intervals to the empirical ones centered on the mean estimated spectra over the 30 Monte–Carlo estimations. The spectrum ground truth of the considered sources is in black.
Current usage metrics show cumulative count of Article Views (full-text article views including HTML views, PDF and ePub downloads, according to the available data) and Abstracts Views on Vision4Press platform.
Data correspond to usage on the plateform after 2015. The current usage metrics is available 48-96 hours after online publication and is updated daily on week days.
Initial download of the metrics may take a while.