Fig. 11.
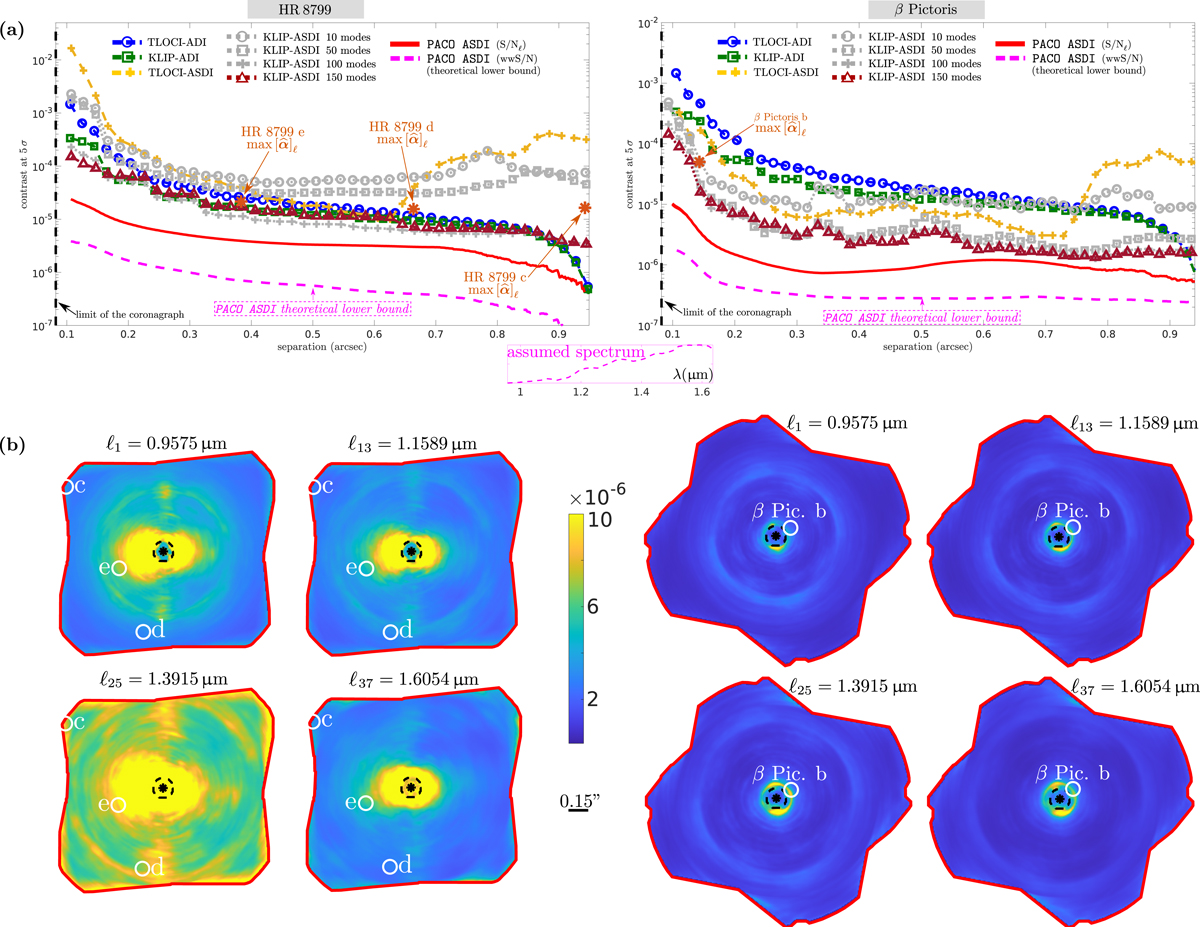
Achievable 5σ contrast on HR 8799 and β Pictoris. a: contrast curves obtained with TLOCI-A(S)DI, KLIP-A(S)DI, and PACO ASDI. All curves correspond to the mean contrast along spectral channels. For PACO ASDI, the solid red line is for the spectral mean S/Nℓ contrast while the dashed pink line is for the spectral mean wwS/N contrast. The wwS/N contrast is the theoretical lower bound given by Eq. (22) when several spectral channels are combined. Contrast curves as provided by KLIP and TLOCI do not correspond to a 5σ false alarms rate contrarily to the contrast curves of PACO ASDI. The achievable contrasts are thus significantly over-optimistic for KLIP and TLOCI, see discussion in the text (Sect. 5.2.2). b: examples of 2D S/Nℓ contrast maps obtained with PACO ASDI for four spectral channels: ℓ1 = 0.9575 μm, ℓ13 = 1.1589 μm, ℓ25 = 1.3915 μm and ℓ37 = 1.6054 μm. The superimposed white circles represent the locations of the known exoplanets.
Current usage metrics show cumulative count of Article Views (full-text article views including HTML views, PDF and ePub downloads, according to the available data) and Abstracts Views on Vision4Press platform.
Data correspond to usage on the plateform after 2015. The current usage metrics is available 48-96 hours after online publication and is updated daily on week days.
Initial download of the metrics may take a while.