Free Access
Fig. 11
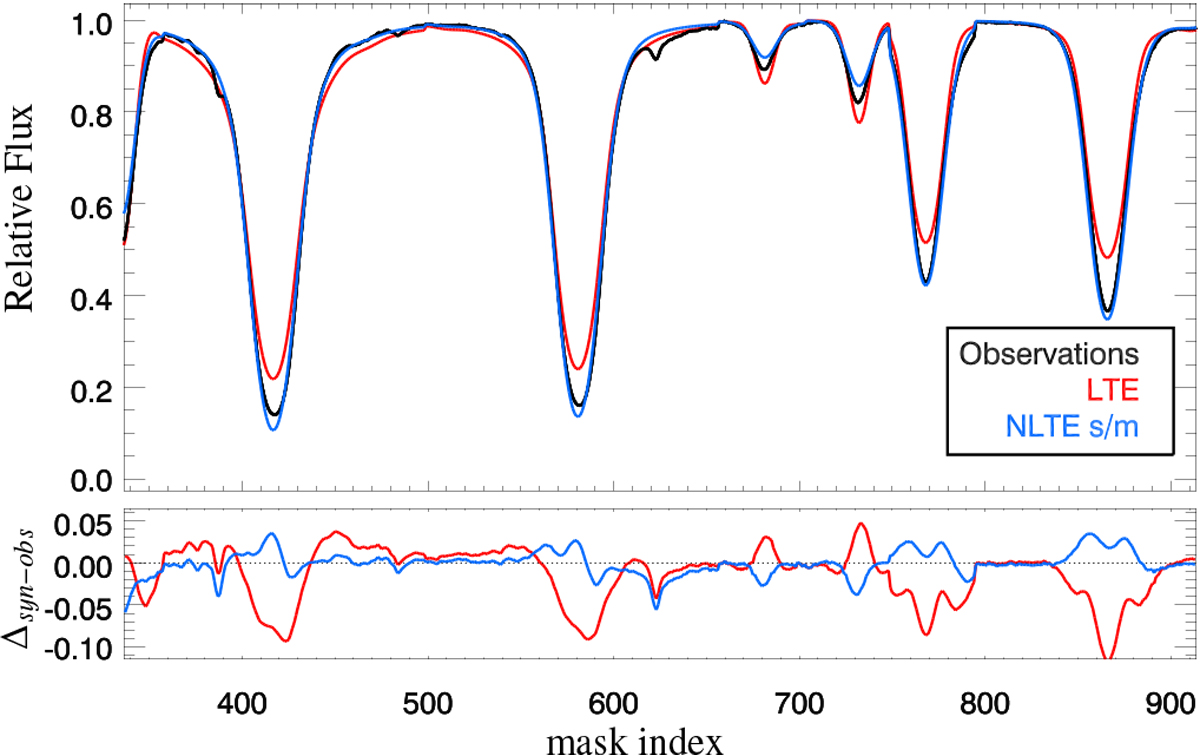
Top: selected lines of Na Observed in Procyon (black) and the best fit for the LTE (red) and NLTE (blue) calculations with the parameters in derived in Table 4. Bottom: difference between observations and the synthetic spectrum in LTE (red) and in NLTE (blue).
Current usage metrics show cumulative count of Article Views (full-text article views including HTML views, PDF and ePub downloads, according to the available data) and Abstracts Views on Vision4Press platform.
Data correspond to usage on the plateform after 2015. The current usage metrics is available 48-96 hours after online publication and is updated daily on week days.
Initial download of the metrics may take a while.