Fig. A.1
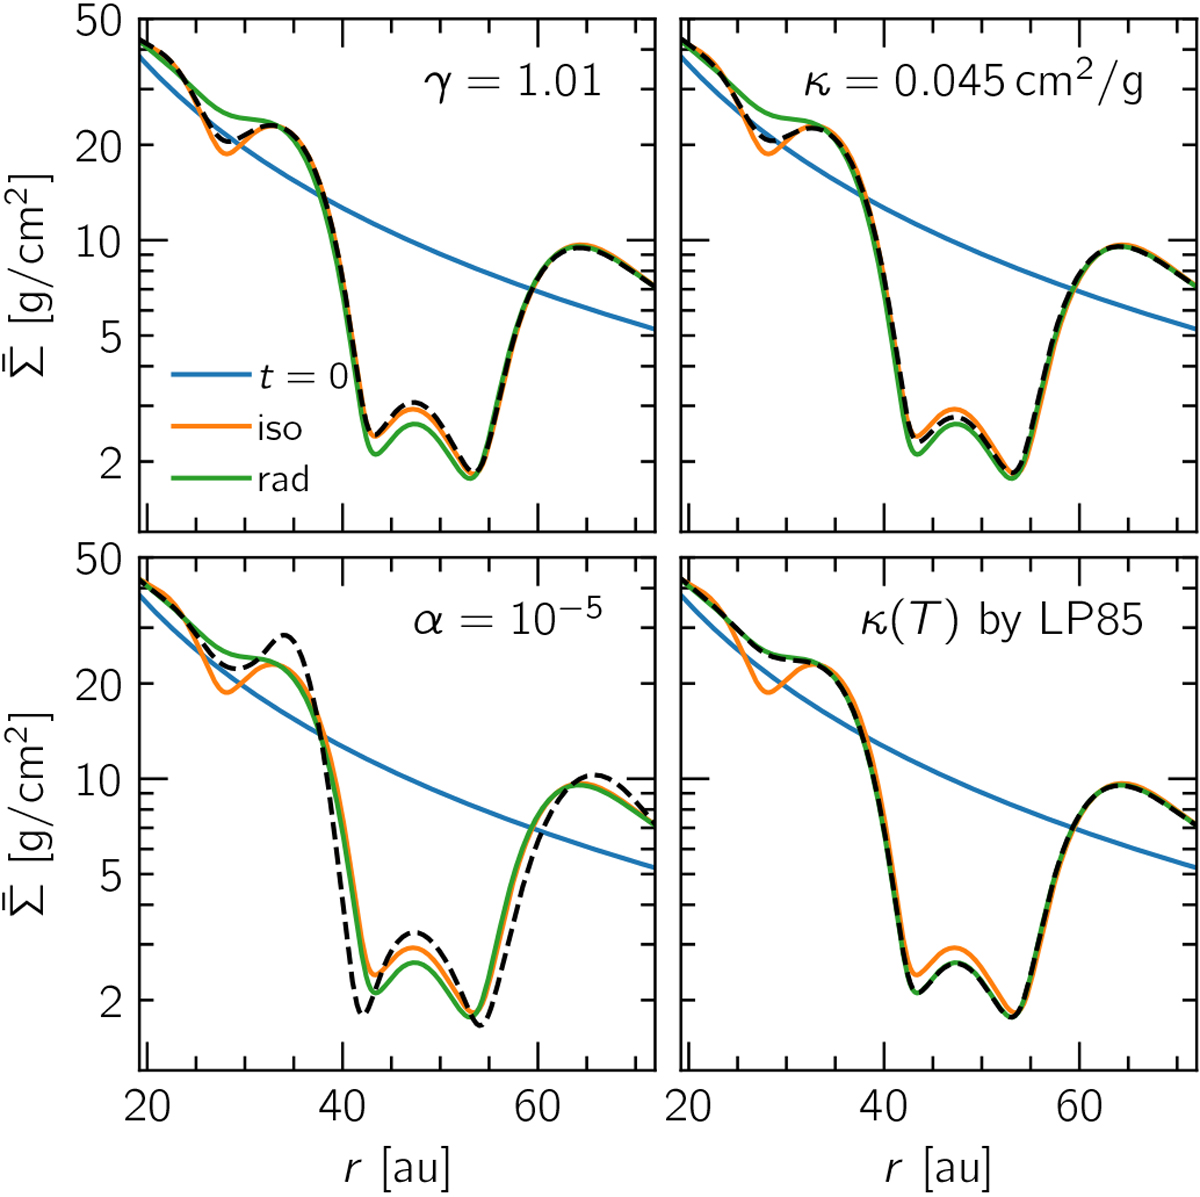
Azimuthally averaged surface density profiles after 1000 orbits for several comparison tests, attempting to recover the locally isothermal limit by constraining radiative effects. The orange and green curves correspond to our fiducial locally isothermal and radiative models, and the change being tested in each panel is plotted with a black dashed line. An adiabatic equation of state with γ = 1.01 or κ = 0.045 cm2/g (instead of 1.4 and 0.45 cm2/g, respectively) roughly reconstructs the gap structure of the locally isothermal model and could allow the formation of a shallower secondary gap. A model with lower viscosity (α = 10−5 instead of 10−4) also shows a secondary gap, but differences in the width of the primary gap and in the outer disk are also visible. The opacity model by Lin & Papaloizou (1985) yields no observable difference.
Current usage metrics show cumulative count of Article Views (full-text article views including HTML views, PDF and ePub downloads, according to the available data) and Abstracts Views on Vision4Press platform.
Data correspond to usage on the plateform after 2015. The current usage metrics is available 48-96 hours after online publication and is updated daily on week days.
Initial download of the metrics may take a while.