Fig. C.1.
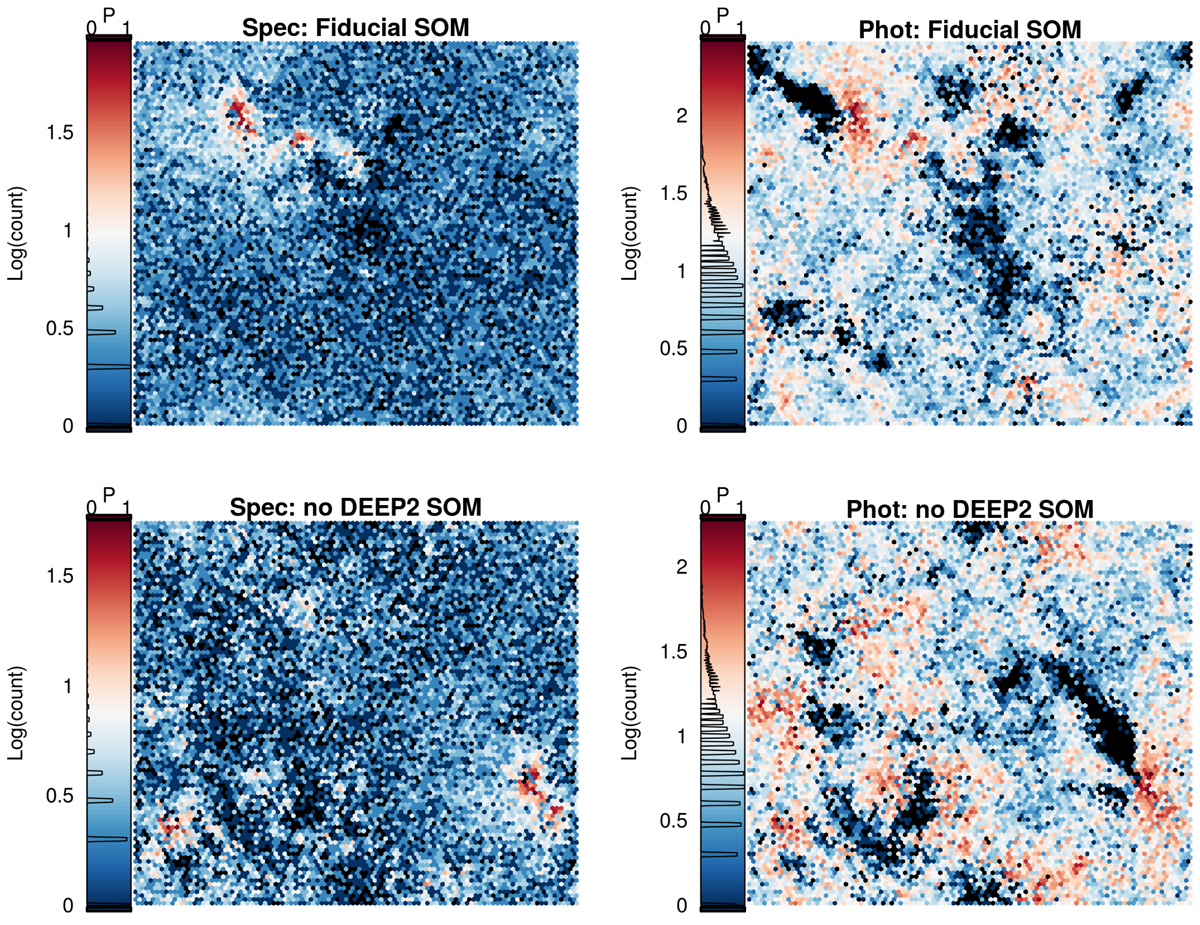
Distribution of spectroscopic (left column) and photometric (right column) data, within our SOMs trained on the full spectroscopic compilation (top row) and the without-DEEP2 compilation (bottom row). The photometric data have similar structures (the missing bright-magnitude wedge can be used as a reference in each of these panels). Despite the different distribution of spectral and photometric data in the two SOMs, the representation statistics remain essentially unchanged: in both cases ∼5% of the photometric data occupy cells not containing spectra.
Current usage metrics show cumulative count of Article Views (full-text article views including HTML views, PDF and ePub downloads, according to the available data) and Abstracts Views on Vision4Press platform.
Data correspond to usage on the plateform after 2015. The current usage metrics is available 48-96 hours after online publication and is updated daily on week days.
Initial download of the metrics may take a while.