Fig. B.2.
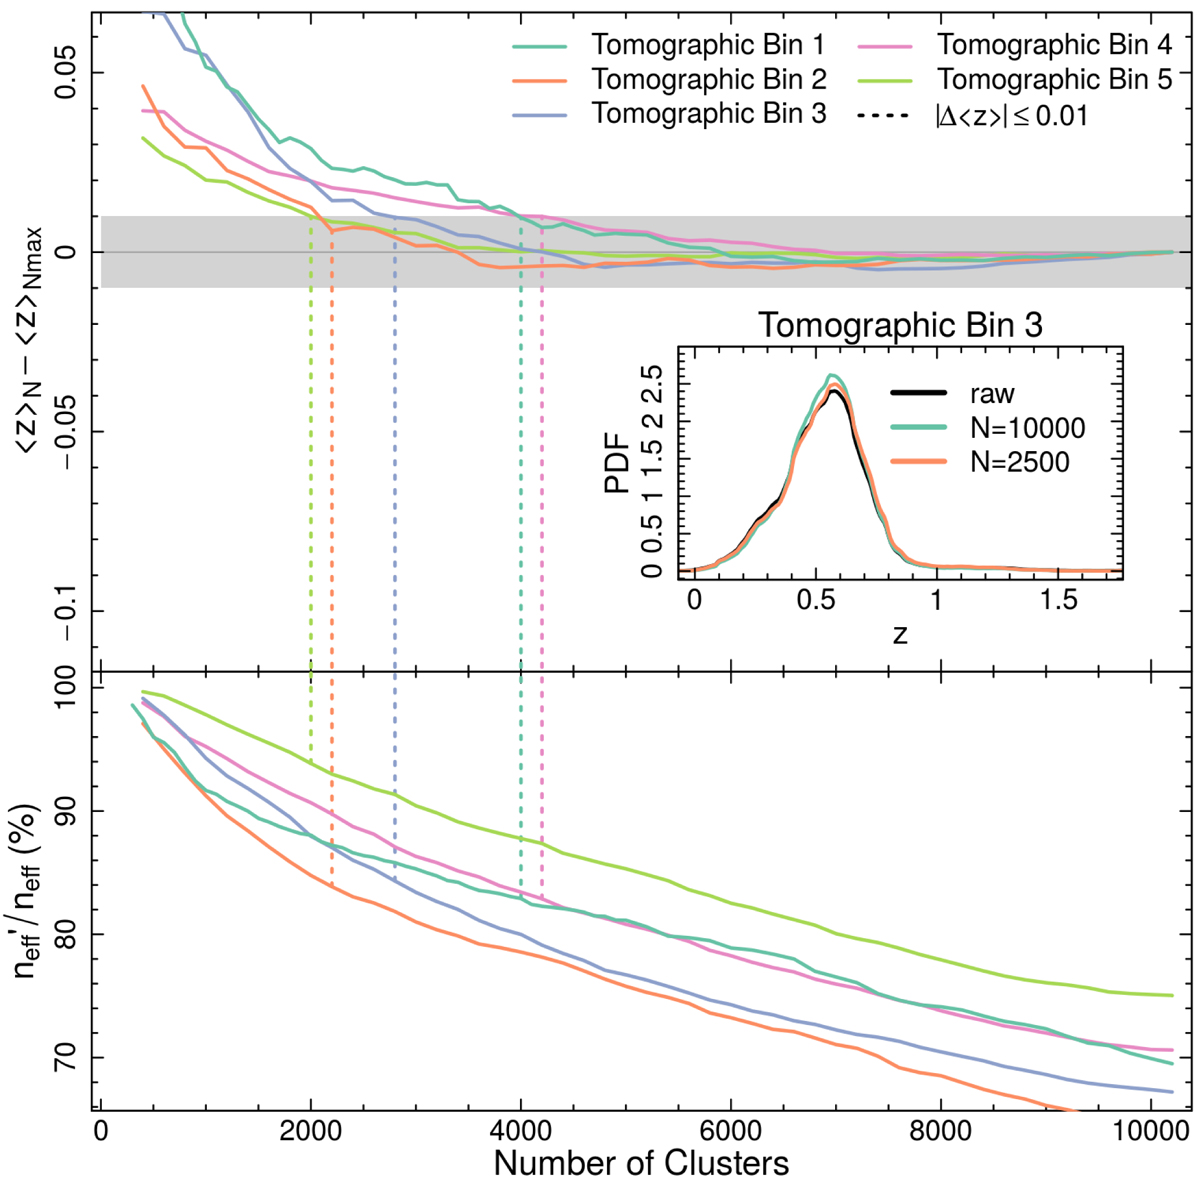
Influence of the number of SOM clusters on the resulting tomographic bin redshifts and the recovered photometric misrepresentation for the full KV450 photometric and spectroscopic datasets. The figure is constructed in the same way as Fig. B.1. Here we additionally show the point at which the tomographic bin mean redshifts cross the |⟨z⟩n − ⟨z⟩max| ≤ 0.01 boundary (shown with grey shading). This criteria designates our per-tomographic-bin cluster-number choice for this work.
Current usage metrics show cumulative count of Article Views (full-text article views including HTML views, PDF and ePub downloads, according to the available data) and Abstracts Views on Vision4Press platform.
Data correspond to usage on the plateform after 2015. The current usage metrics is available 48-96 hours after online publication and is updated daily on week days.
Initial download of the metrics may take a while.