Fig. B.1.
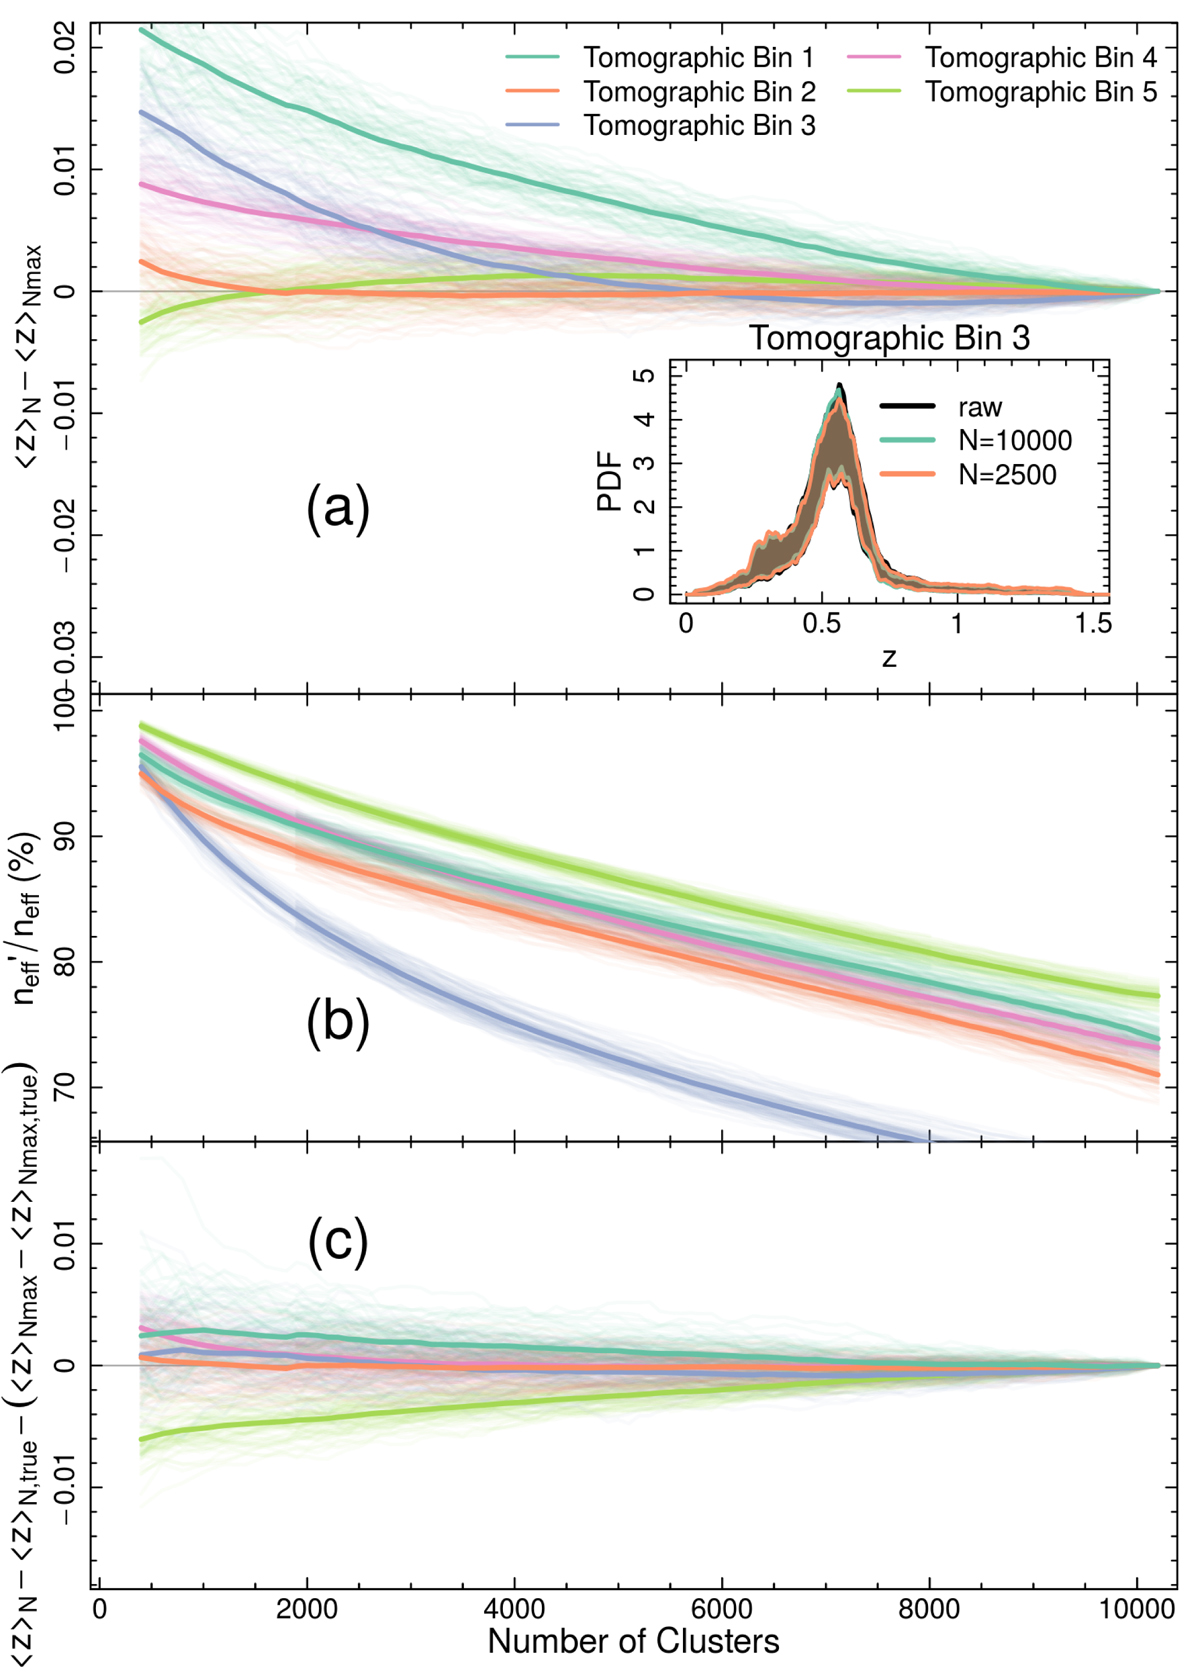
Influence of the number of SOM clusters on the resulting tomographic bin redshifts and the recovered photometric misrepresentation for the MICE2 simulation dataset. We show three statistics as a function of cluster number. Panel a: change in the tomographic mean estimate. Panel b: change in the representation of the spectroscopic catalogue. Panel c: change in the tomographic mean bias. The inset of panel a shows the distribution of PDFs estimated for the third tomographic bin with 10 000 and 2500 clusters. The black curve shows the distribution of the unweighted spec-z sample. Panel a demonstrates that, with increasing cluster number, our estimate of the tomographic redshift distribution mean changes significantly. Middle panel: demonstrates why: with more clusters there is more fragmentation of the photometric data and significant decreases in the spectroscopic representation, such that the “gold” sample decreases in size. However, crucially, panel c demonstrates that the loss of representation does not change the low level of bias in the recovered redshift distribution.
Current usage metrics show cumulative count of Article Views (full-text article views including HTML views, PDF and ePub downloads, according to the available data) and Abstracts Views on Vision4Press platform.
Data correspond to usage on the plateform after 2015. The current usage metrics is available 48-96 hours after online publication and is updated daily on week days.
Initial download of the metrics may take a while.