Fig. 3.
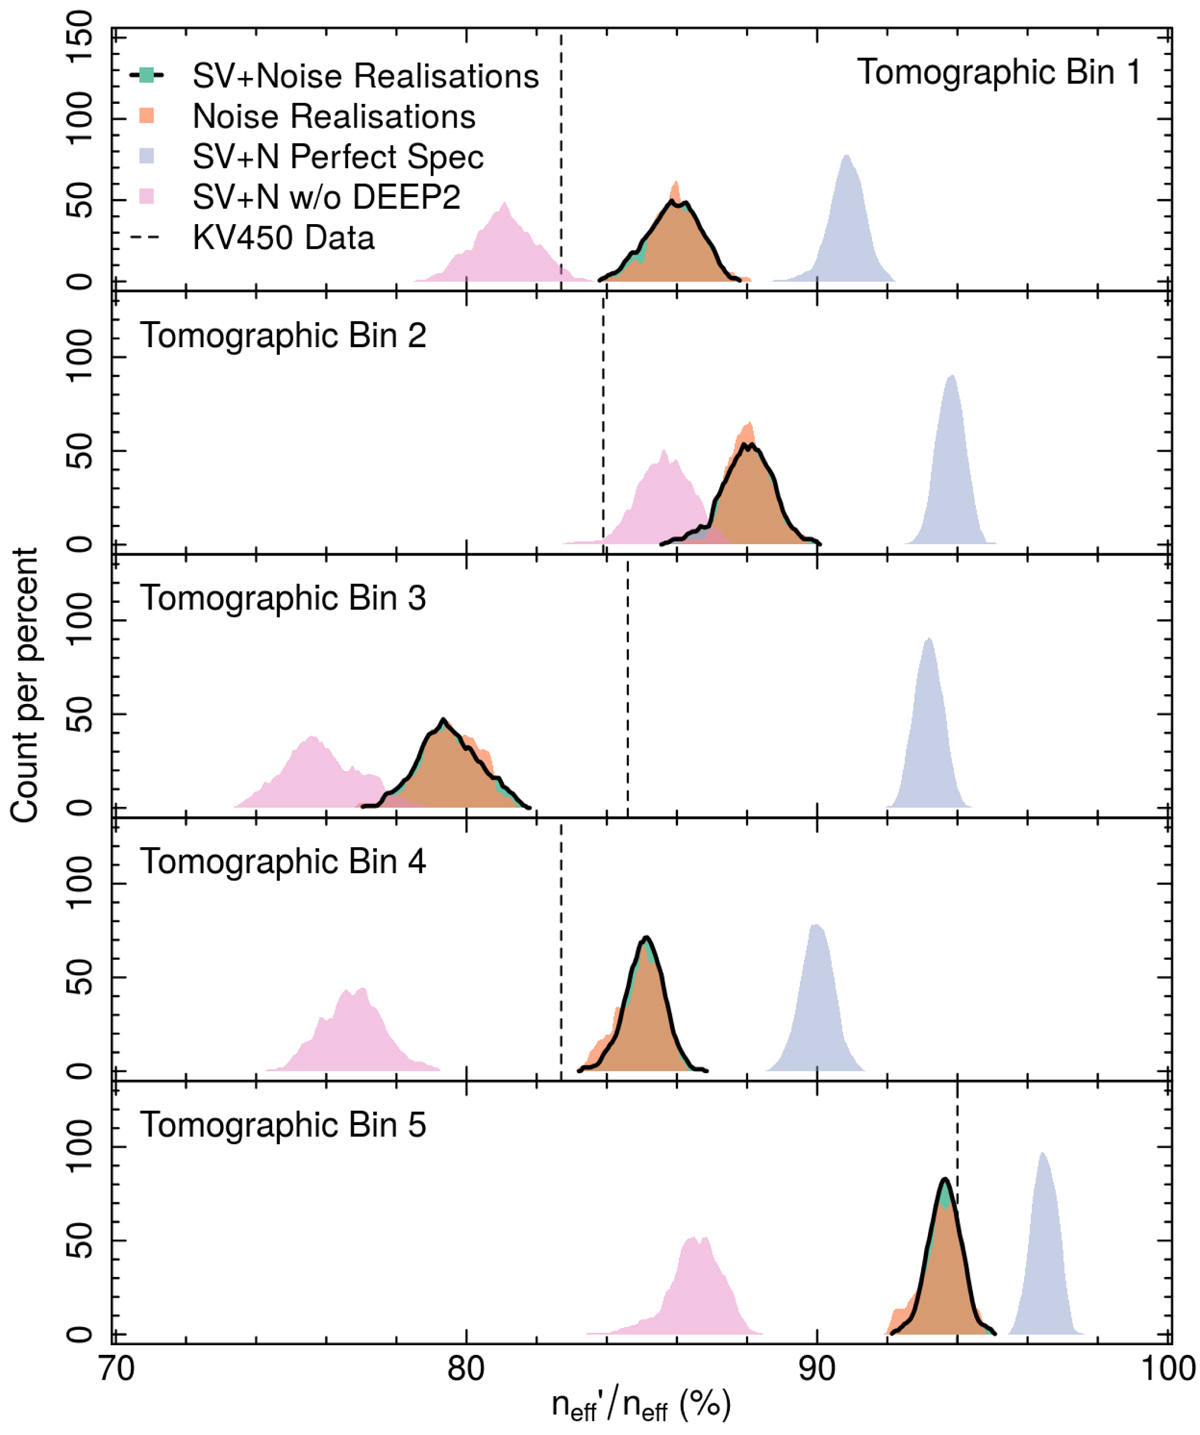
Change in the value of ![]() with 100 different lines of sight (testing both noise and sample variance; green), 100 different noise realisations of a single line-of-sight (testing the importance of photometric noise; orange), 100 perfectly sampled spectroscopic catalogues (testing spectroscopic selection effects; purple), and 100 lines-of-sight excluding DEEP2 (testing the similarities to simulations and data; pink). The representations seen in the real KV450 data are also shown (black dashed lines). The distributions show that simulation is a reasonable match to the observed representations, being typically within ±5% of the representations seen in the data. We see that photometric noise dominates our observed misrepresentation, and that the MICE2 KV450-like spectroscopic compilation is typically ∼5% less representative of the full photometric sample, when compared to a perfectly sampled spectral catalogue (with the exception of bin 3). Thus the majority of the under-representation is caused by Poisson sampling and photometric noise.
with 100 different lines of sight (testing both noise and sample variance; green), 100 different noise realisations of a single line-of-sight (testing the importance of photometric noise; orange), 100 perfectly sampled spectroscopic catalogues (testing spectroscopic selection effects; purple), and 100 lines-of-sight excluding DEEP2 (testing the similarities to simulations and data; pink). The representations seen in the real KV450 data are also shown (black dashed lines). The distributions show that simulation is a reasonable match to the observed representations, being typically within ±5% of the representations seen in the data. We see that photometric noise dominates our observed misrepresentation, and that the MICE2 KV450-like spectroscopic compilation is typically ∼5% less representative of the full photometric sample, when compared to a perfectly sampled spectral catalogue (with the exception of bin 3). Thus the majority of the under-representation is caused by Poisson sampling and photometric noise.
Current usage metrics show cumulative count of Article Views (full-text article views including HTML views, PDF and ePub downloads, according to the available data) and Abstracts Views on Vision4Press platform.
Data correspond to usage on the plateform after 2015. The current usage metrics is available 48-96 hours after online publication and is updated daily on week days.
Initial download of the metrics may take a while.