Fig. 2.
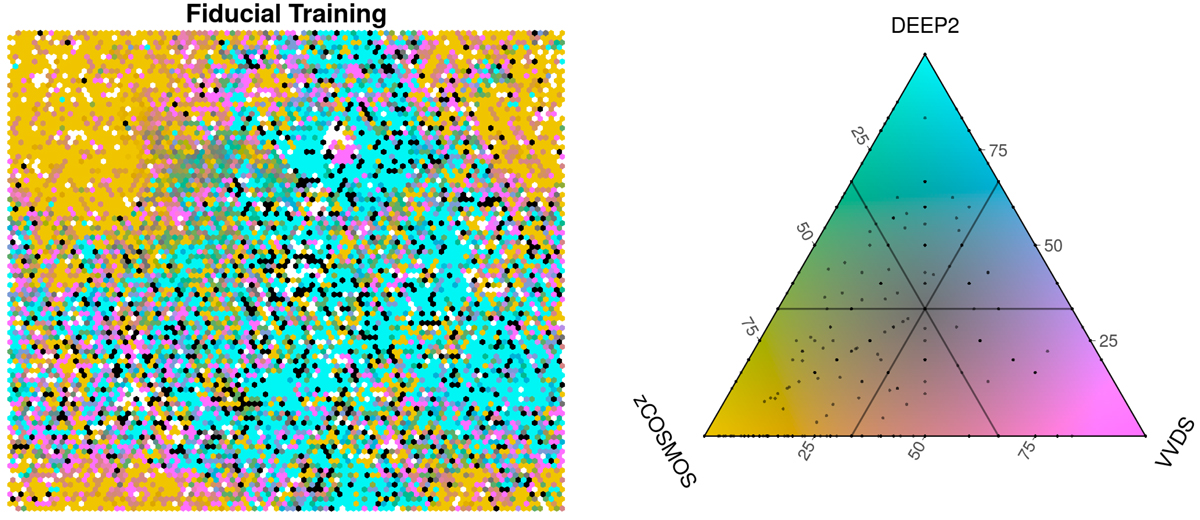
Distribution of the three primary KV450 spectroscopic samples within the SOM. The figure on the left shows the SOM coloured by the fractional contribution of each of the three main spectroscopic samples from KV450. The ternary colour bar is shown on the right. The makeup of individual cells is annotated within the colour-bar as points. SOM cells that are filled entirely by sources from DEEP2, for example, are blue. Conversely cells that are filled by equal mixtures from all three samples are grey. Cells which contain spectroscopic data from other surveys (which are not shown) are coloured white. Cells which contain photometric galaxies but no spectroscopy from any survey are coloured black. The figure highlights the complementarity between the DEEP2 and zCOSMOS data, as well as the breadth of coverage of the VVDS data.
Current usage metrics show cumulative count of Article Views (full-text article views including HTML views, PDF and ePub downloads, according to the available data) and Abstracts Views on Vision4Press platform.
Data correspond to usage on the plateform after 2015. The current usage metrics is available 48-96 hours after online publication and is updated daily on week days.
Initial download of the metrics may take a while.