Fig. D.1.
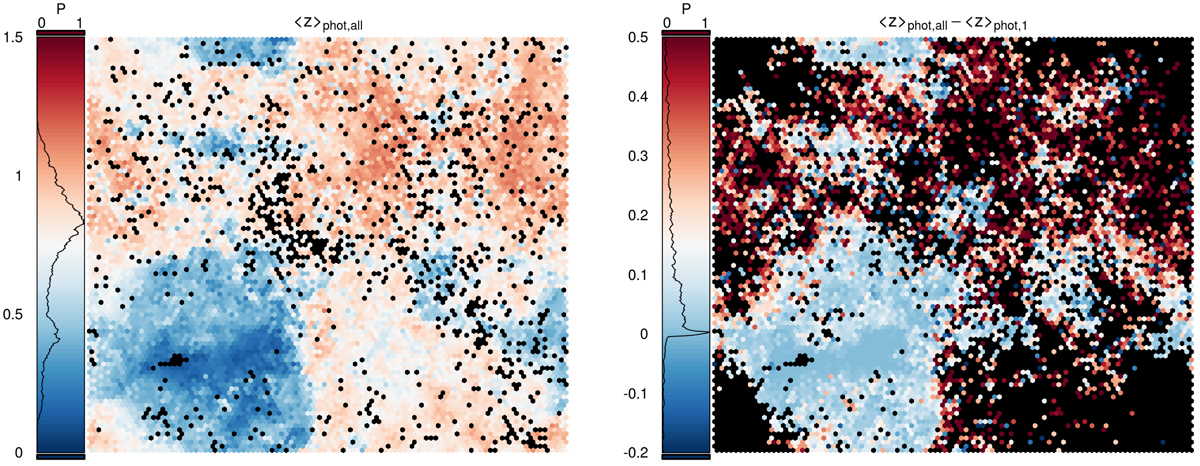
Left: distribution of mean redshift as a function of SOM cell for the fiducial MICE2 simulation. Right: distribution of the difference in SOM cell mean redshifts for the full photometric sample compared to the first tomographic bin. The figure demonstrates that the N(z) of the high-z SOM cells in the lowest tomographic bin is systematically different to those cells in the full sample. This effect creates the bias observed in the SOM direct calibration.
Current usage metrics show cumulative count of Article Views (full-text article views including HTML views, PDF and ePub downloads, according to the available data) and Abstracts Views on Vision4Press platform.
Data correspond to usage on the plateform after 2015. The current usage metrics is available 48-96 hours after online publication and is updated daily on week days.
Initial download of the metrics may take a while.