Fig. 1.
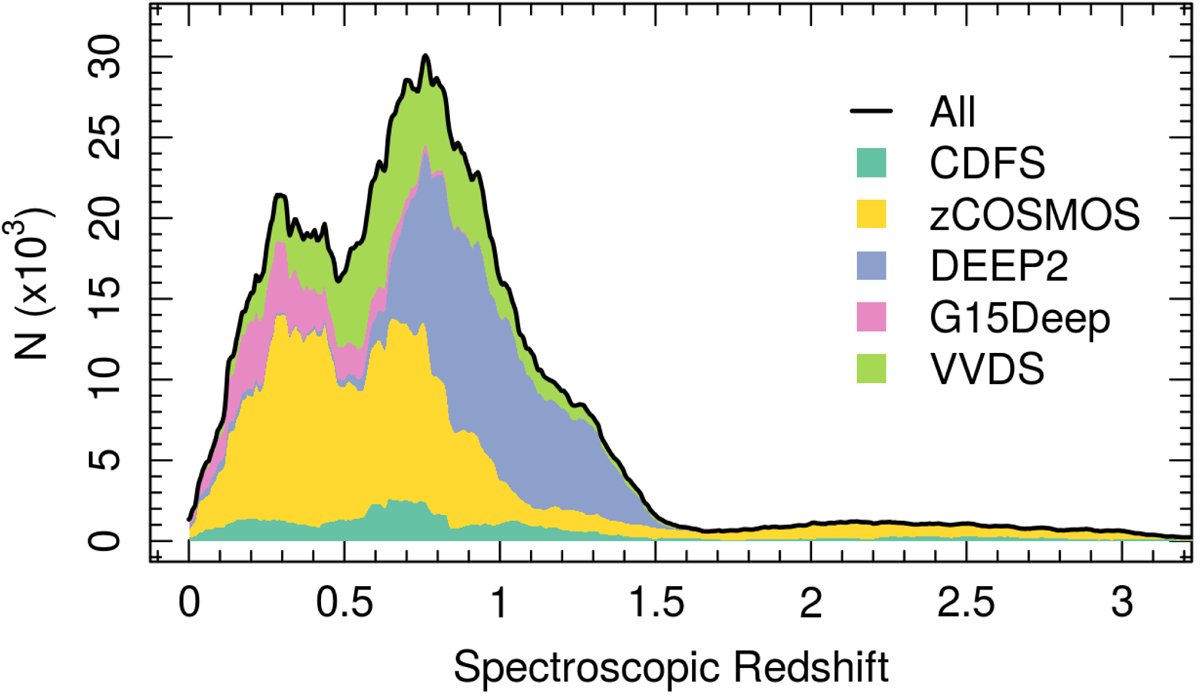
Spectroscopic redshift distribution of our combined spectroscopic calibration dataset. The figure shows the redshift distribution as a kernel density estimate (KDE), constructed using a rectangular δz = 0.1 kernel. The KDE is weighted such that lines are interpretable as the instantaneous counts per δz. The KDE is coloured by the fractional contribution from each of our five datasets to the total, which is shown by the black line.
Current usage metrics show cumulative count of Article Views (full-text article views including HTML views, PDF and ePub downloads, according to the available data) and Abstracts Views on Vision4Press platform.
Data correspond to usage on the plateform after 2015. The current usage metrics is available 48-96 hours after online publication and is updated daily on week days.
Initial download of the metrics may take a while.