Fig. 9.
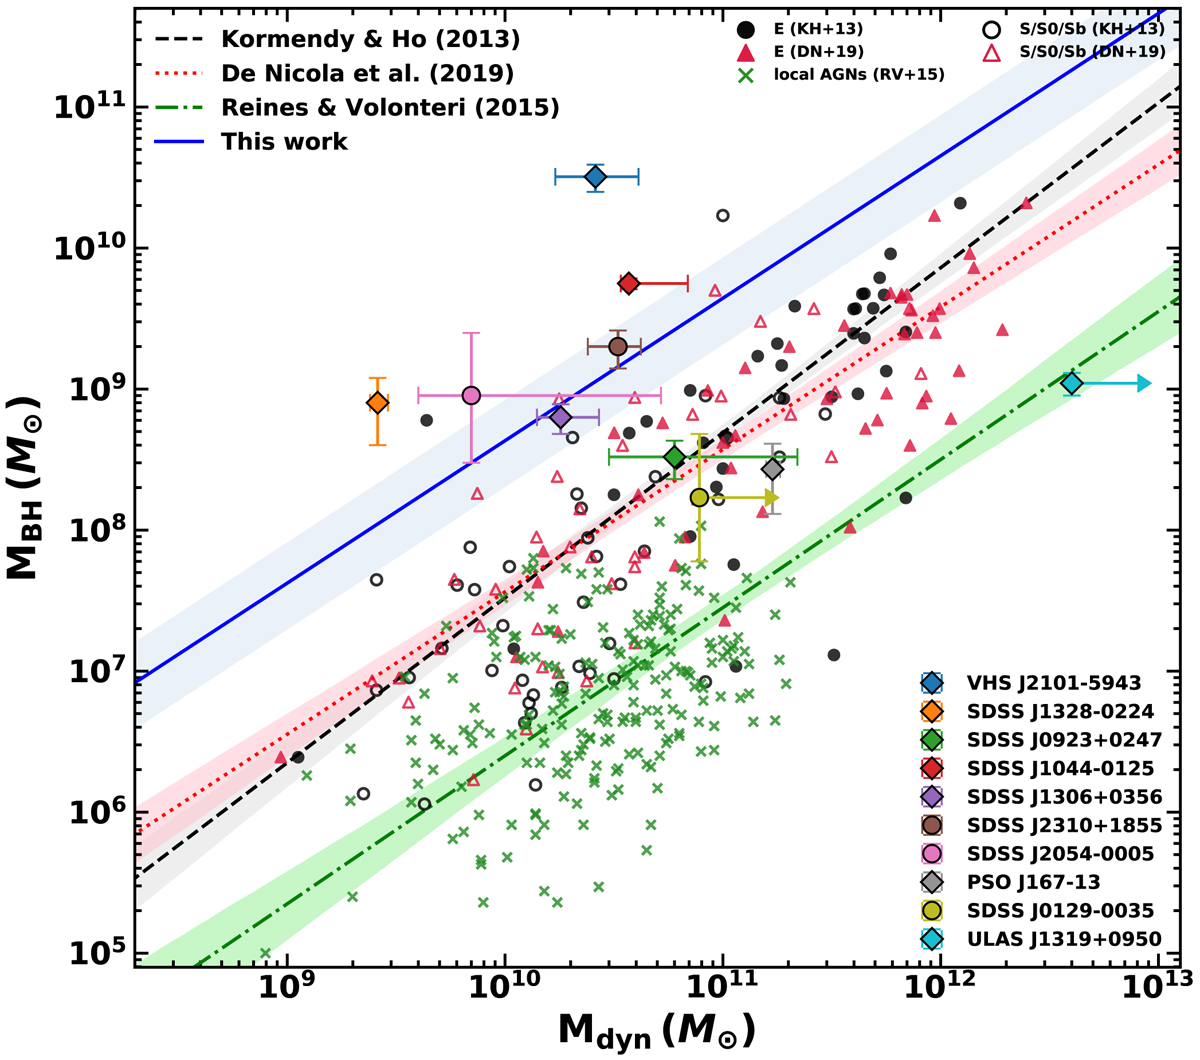
High-redshift relation between the black hole mass (MBH) and the dynamical mass of the host galaxy (Mdyn). The dashed black line and the dotted red line represent the reference local relation inferred using samples of local galaxies (E = ellipticals, S/S0/Sb = spirals) shown as black dots (Kormendy & Ho 2013, also indicated as KH+13) and red triangles (de Nicola et al. 2019, or DN+19). The green line is the relation found by Reines & Volonteri (2015, or RV+15) by measuring the total stellar mass in a sample of the local AGN (green crosses). The solid blue line is the best fit to our data. The shadowed areas show the 1σ uncertainty. In the case of SDSS J0129−0035 and ULAS J1319+0950, we inferred a lower limit on the dynamical mass. We do not take these data into account in the fit. The circles of our data points indicate the sources for which the BH masses are estimated from bolometric luminosity assuming Eddington accretion.
Current usage metrics show cumulative count of Article Views (full-text article views including HTML views, PDF and ePub downloads, according to the available data) and Abstracts Views on Vision4Press platform.
Data correspond to usage on the plateform after 2015. The current usage metrics is available 48-96 hours after online publication and is updated daily on week days.
Initial download of the metrics may take a while.