Fig. 6.
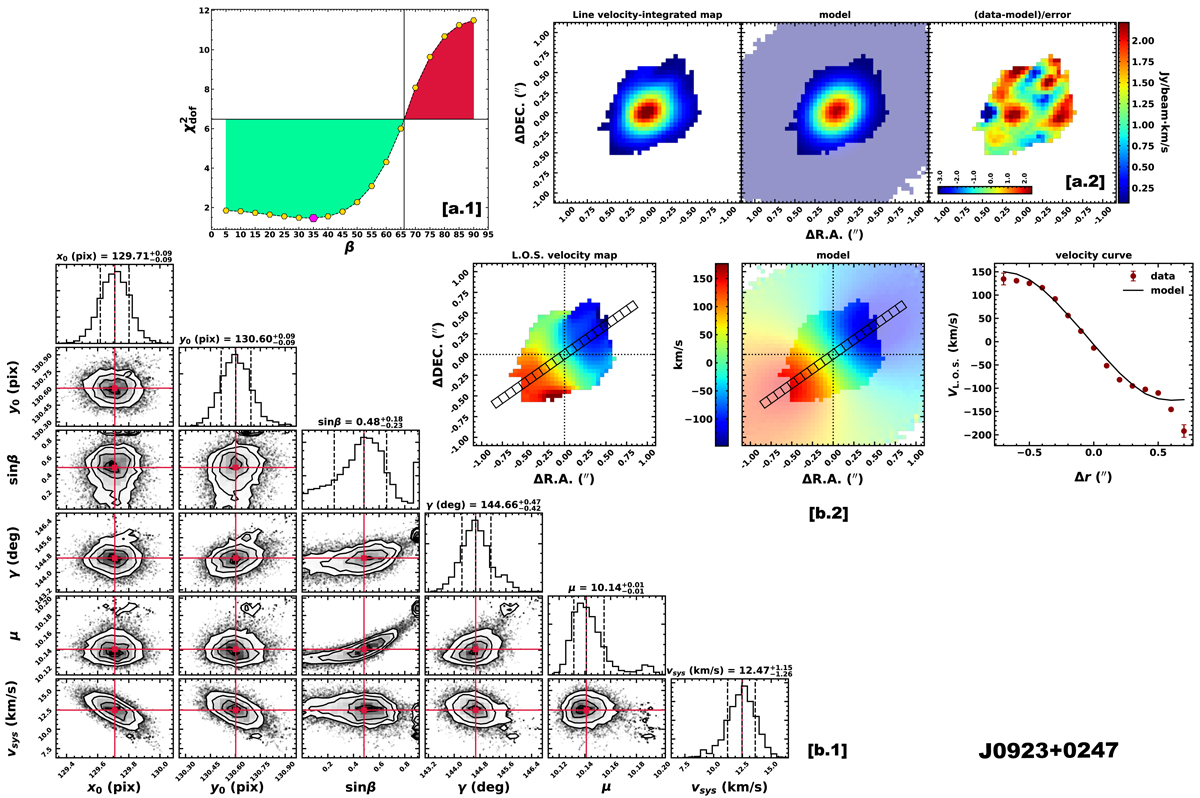
Kinematical modelling performed on SDSS J0923+0247. Upper panels [a.1] and [a.2]: fit result of the flux map, bottom panels [b.1] and [b.2]: result of the 2D velocity field fit. [a.1]: curve of χ2 minima as a function of the disc inclination (see Sect. 4.2 for details). The magenta hexagon indicates the absolute minimum (=35 deg) of χm(β). The green area (see Sect. 4.3 for the definition) indicates the allowed inclination values used as a prior in performing a 2D velocity field fit. [a.2]: 2D best-fit model of the flux map. From left to right, we report the observed map, the model, and the residuals ([data-model]/error). Residuals values are color-coded according to the horizontal colorbar displayed at the bottom-left corner of the panel. [b.1]: the posterior probability distributions of the free parameters in 2D velocity field fits retrieved with the MCMC algorithm with the best values and their uncertainties. [b.2]: 2D best-fit model of the kinematical map. From left to right, we report the observed velocity map, the model, and the velocity curves extracted from a long-slit of two pixels in width aligned with the line of nodes. The slit is superimposed on maps; red circles and solid black lines in the right panel indicate the observed flux-weighted velocity values in each bin of the slit and the model, respectively.
Current usage metrics show cumulative count of Article Views (full-text article views including HTML views, PDF and ePub downloads, according to the available data) and Abstracts Views on Vision4Press platform.
Data correspond to usage on the plateform after 2015. The current usage metrics is available 48-96 hours after online publication and is updated daily on week days.
Initial download of the metrics may take a while.