Fig. 2.
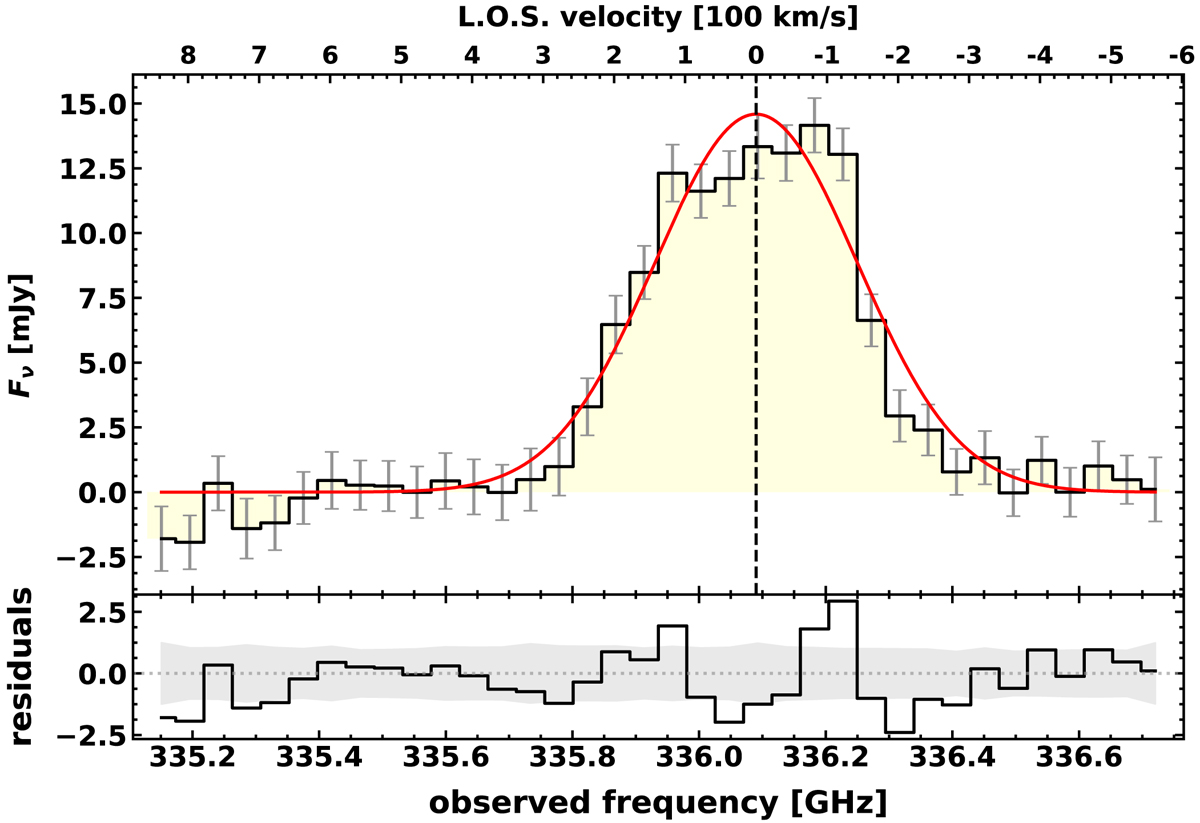
Integrated spectrum of source SDSS J0923+0247. Top panel: the observed data is shown in light yellow with error bars in grey (rms in each channel). The red solid curve is the best-fit Gaussian model. The velocity scale (top axis) has as its referecence the central frequency of the best fit. Bottom panel: the fit residuals (model-data), the grey filled area shows the rms along the spectral axis.
Current usage metrics show cumulative count of Article Views (full-text article views including HTML views, PDF and ePub downloads, according to the available data) and Abstracts Views on Vision4Press platform.
Data correspond to usage on the plateform after 2015. The current usage metrics is available 48-96 hours after online publication and is updated daily on week days.
Initial download of the metrics may take a while.