Fig. B.1.
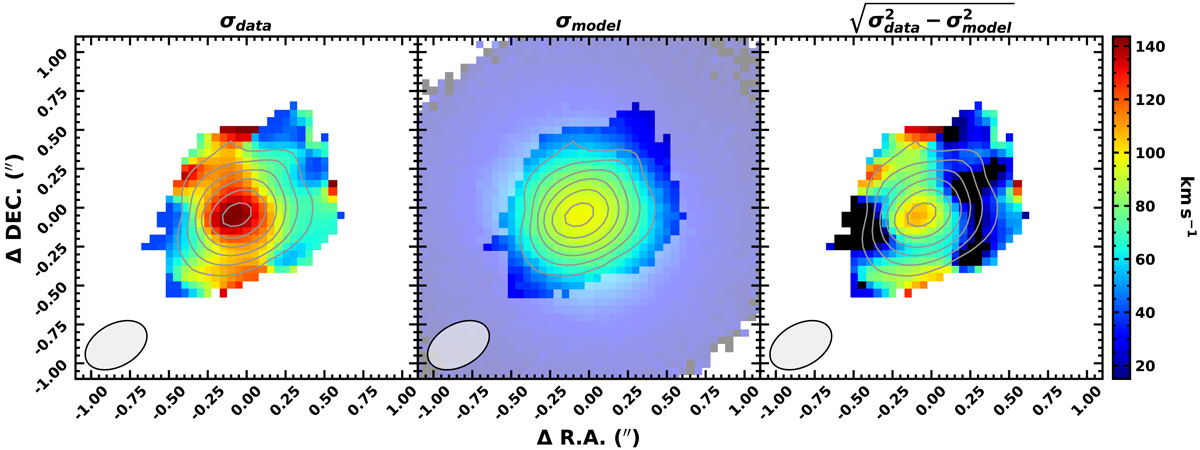
Estimation of local velocity dispersion in J0923+0247. Left panel: observed velocity-dispersion field. Central panel: simulated flux-weighted velocity-dispersion map along the line of sight, corresponding to the best-fit model of the velocity field. Right panel: quadratic residuals representing the local velocity dispersion along the line of sight. The contours show the line-velocity integrated map. The contours correspond to [0.25I0, 0.5I0, I0/e, 0.68I0, 0.9I0], where I0 is the maximum value of the observed flux. In the bottom-left corner of each panel, the FHWM of the synthesised beam is shown.
Current usage metrics show cumulative count of Article Views (full-text article views including HTML views, PDF and ePub downloads, according to the available data) and Abstracts Views on Vision4Press platform.
Data correspond to usage on the plateform after 2015. The current usage metrics is available 48-96 hours after online publication and is updated daily on week days.
Initial download of the metrics may take a while.