Fig. 12.
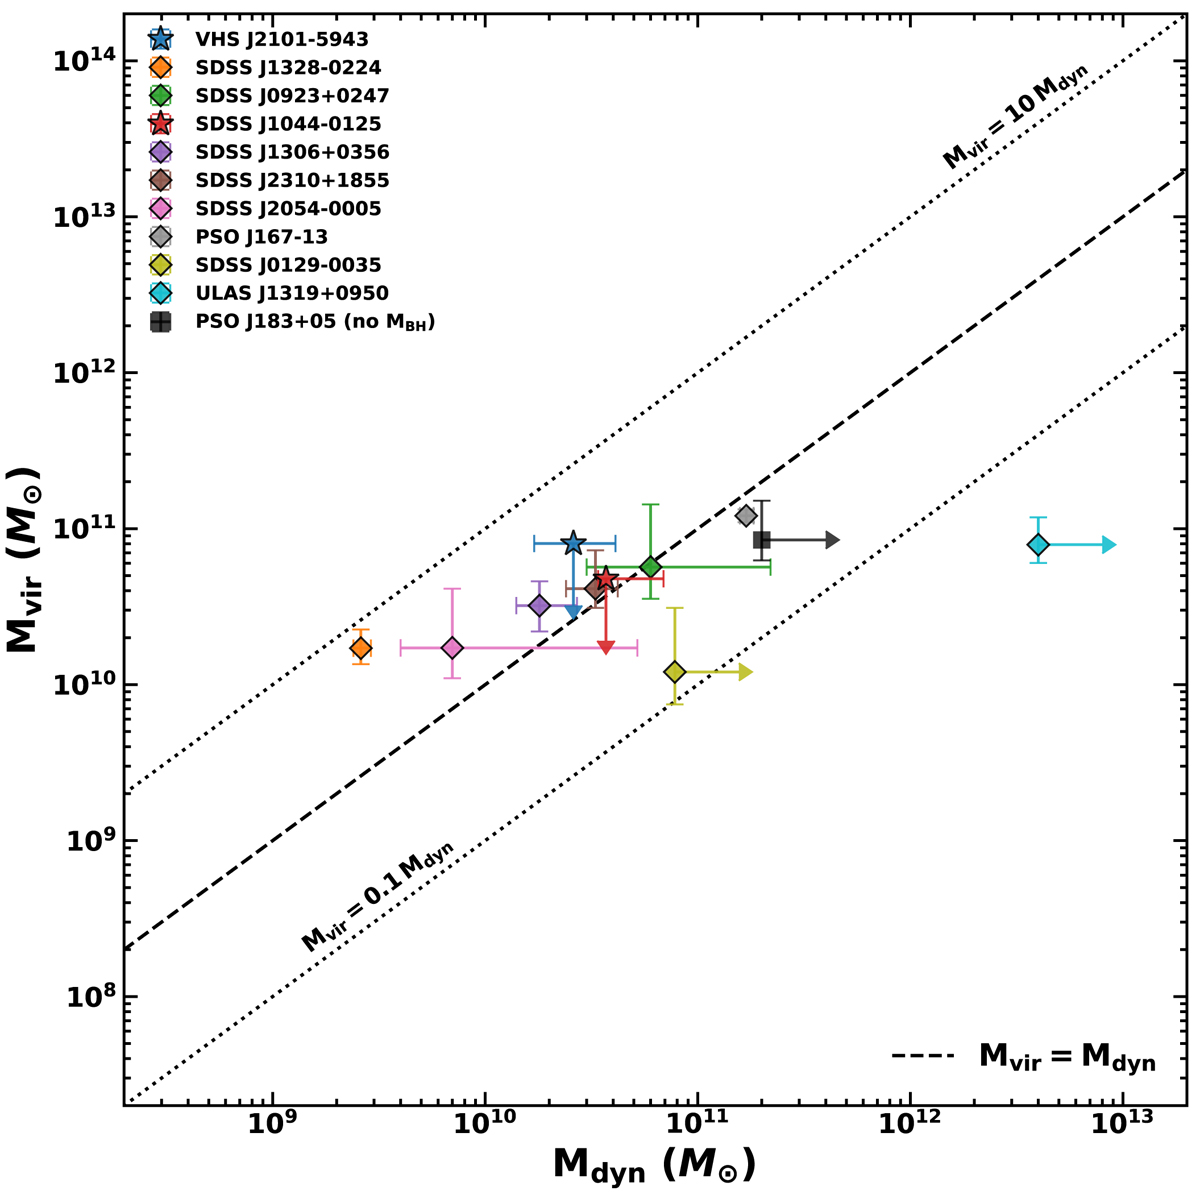
Comparison between dynamical virial mass (Mvir) computed using flux map properties and dynamical mass (Mdyn) obtained with the full kinematical model of the gas velocity field. The dashed line indicates the 1:1 relation, while dotted lines are 1 dex shifts. The objects represented with star symbols are upper limits on virial mass, since their emission appears consistent with a point-like source (as a result of 2D Gaussian fits within CASA). In these cases, following Willott et al. (2015a), we assume β = 55 deg as disc inclination angle. The black square indicates PSO J183−05, for which we retrieved a lower limit on Mdyn, but for which MBH is not available.
Current usage metrics show cumulative count of Article Views (full-text article views including HTML views, PDF and ePub downloads, according to the available data) and Abstracts Views on Vision4Press platform.
Data correspond to usage on the plateform after 2015. The current usage metrics is available 48-96 hours after online publication and is updated daily on week days.
Initial download of the metrics may take a while.