Fig. A.1
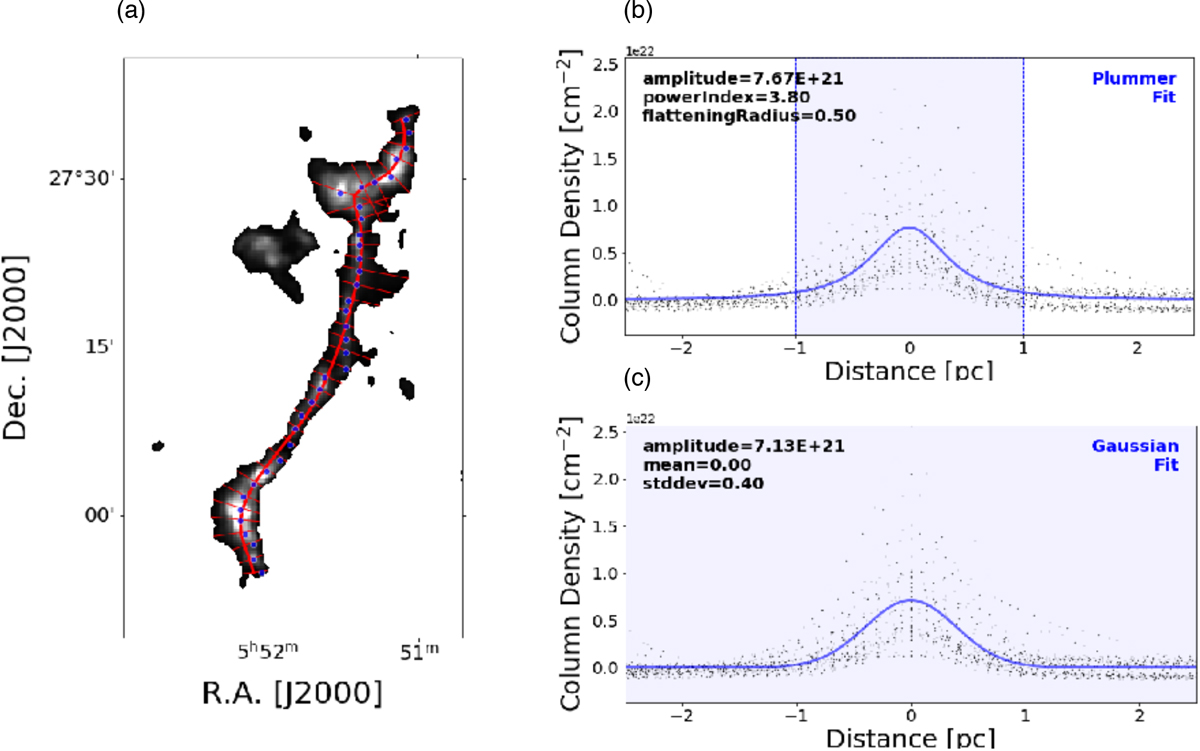
Radial profile for H2
column density for the filament S242. Panel a: distribution of radial cuts along the spine of filament S242. The red curve represents the spine across the entire filament S242, extractedby FilFinder. The blue dots show the sampling points with an interval of
~0.7 pc. The red radial lines, perpendicular to the tangent of the spine, are the cuts used to calculated the radial distances from the spine. Panels b and c: Plummer and Gaussian fitting for the radial profiles. The black dots represent the value of
![]() along the cuts with respect to their distance from the spine. The Plummer and Gaussian fit is indicated by the blue lines in panel b and panel c, respectively. The best-fit parameters for each function are given in the upper corner of each panel.
along the cuts with respect to their distance from the spine. The Plummer and Gaussian fit is indicated by the blue lines in panel b and panel c, respectively. The best-fit parameters for each function are given in the upper corner of each panel.
Current usage metrics show cumulative count of Article Views (full-text article views including HTML views, PDF and ePub downloads, according to the available data) and Abstracts Views on Vision4Press platform.
Data correspond to usage on the plateform after 2015. The current usage metrics is available 48-96 hours after online publication and is updated daily on week days.
Initial download of the metrics may take a while.