Fig. 8
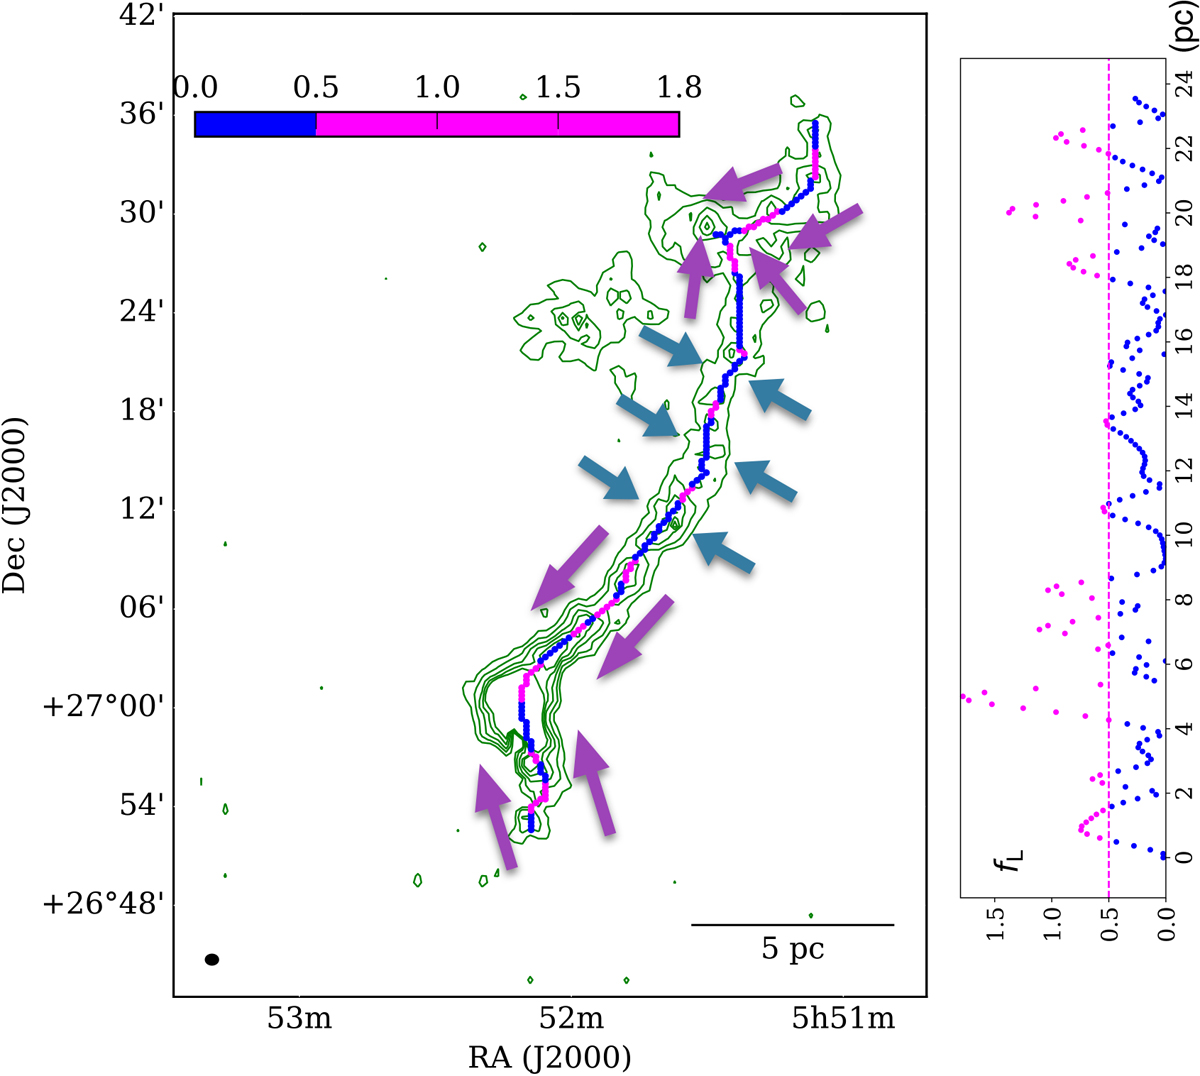
Sketch of the subsequent longitudinal accretion of the filament S242. The overlaid green contours display 13CO column density distribution of filament S242, ranging from 15 to 90% stepped by 15% of the value (1.5 × 1016 cm−2). The skeleton structures of the filament S242 are color-coded by the longitudinal factor fL, which is the contribution of longitudinal collapse for the observed velocity dispersion. The magenta arrows indicate the direction of gas motion in longitudinal collapse and accretion, the blue arrows in radial collapse. The right subpanel presents the profile of longitudinal factor fL along the spine of filament S242.
Current usage metrics show cumulative count of Article Views (full-text article views including HTML views, PDF and ePub downloads, according to the available data) and Abstracts Views on Vision4Press platform.
Data correspond to usage on the plateform after 2015. The current usage metrics is available 48-96 hours after online publication and is updated daily on week days.
Initial download of the metrics may take a while.