Fig. 7
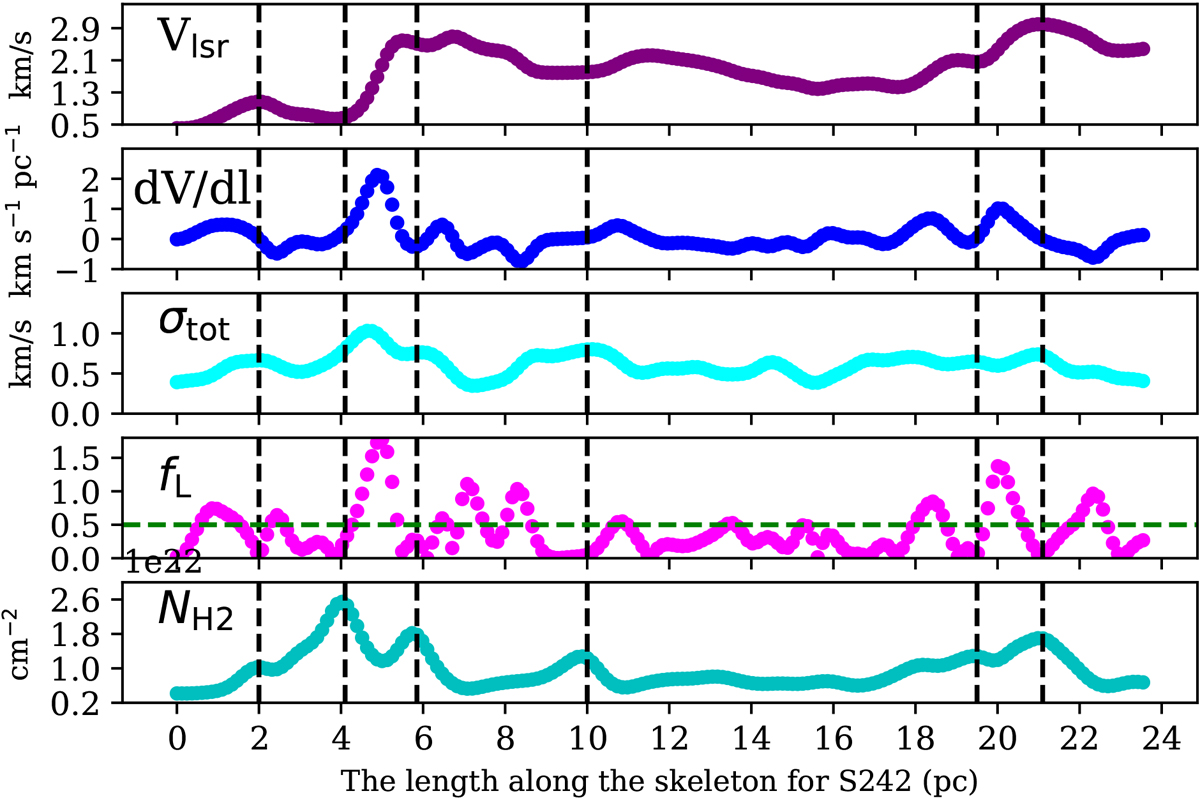
Convolved profiles of centroid velocity (Vlsr), velocity gradients (dV/dl), total 1D velocity dispersion (σtot), the contribution of longitudinal collapse in the total velocity dispersion (fL), and the H2 column density. The vertical black dashed lines indicate the peaks of the H2 column density profile; the horizontal green dashed line represents fL = 0.5.
Current usage metrics show cumulative count of Article Views (full-text article views including HTML views, PDF and ePub downloads, according to the available data) and Abstracts Views on Vision4Press platform.
Data correspond to usage on the plateform after 2015. The current usage metrics is available 48-96 hours after online publication and is updated daily on week days.
Initial download of the metrics may take a while.