Fig. 6
Upper panel: velocity dispersion (![]() ) against the H2
column density (
) against the H2
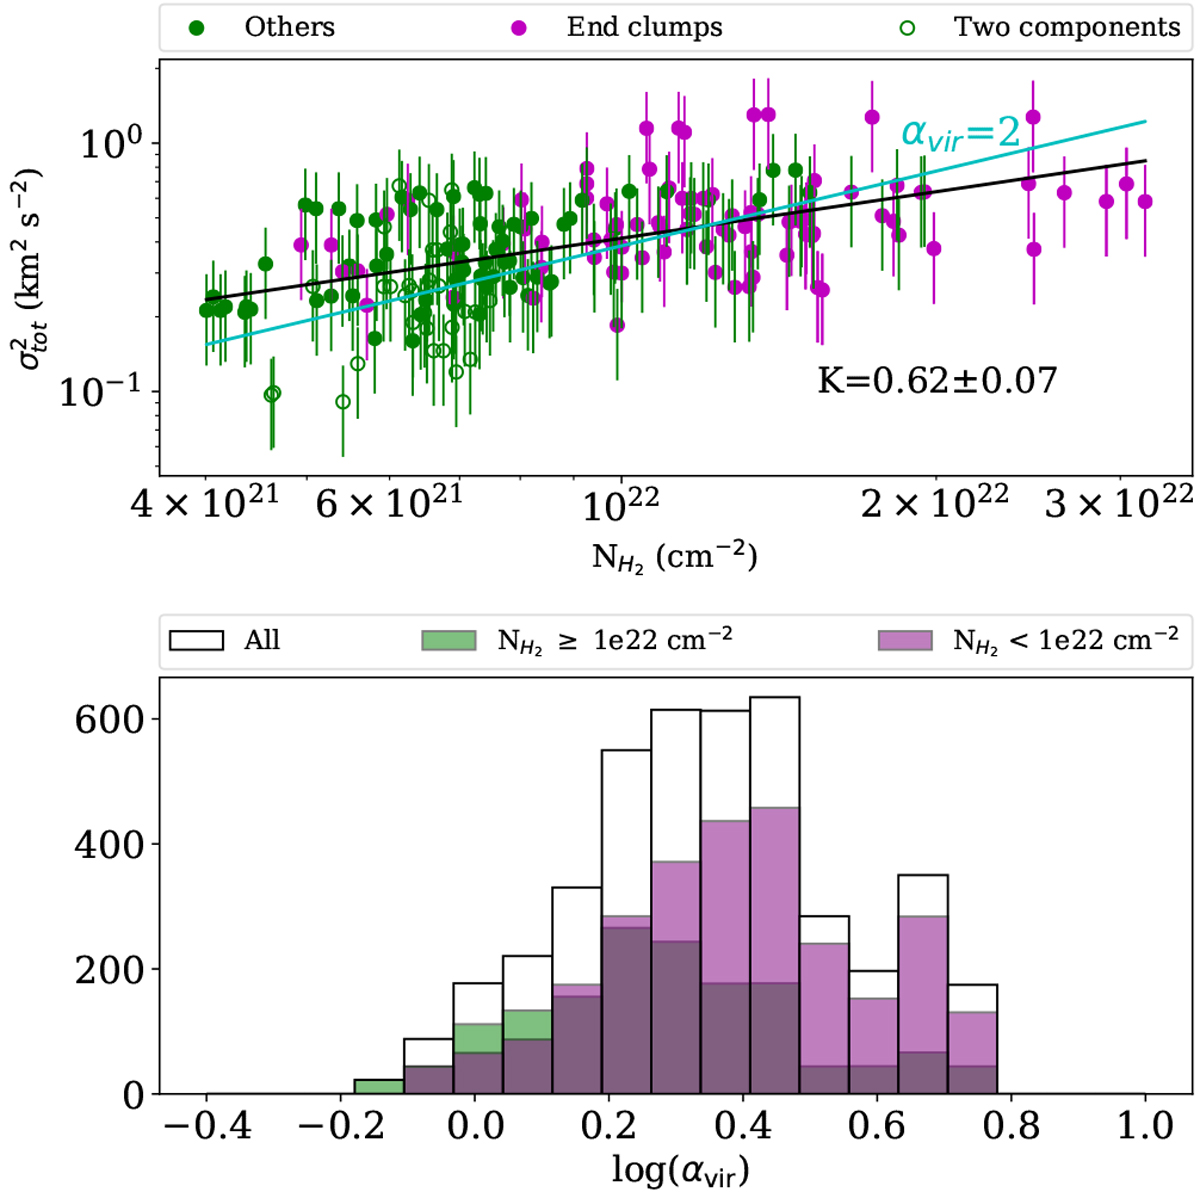
column density (![]() ) for the S242 main skeletons. The magenta dots represent the skeleton structures in both end-clumps, the green dots are other skeleton regions not located in the end regions, the open green circles represent the value in the length ranges of
~6.5–8.5 pc and 13.5–15.5 pc, which are calculated by the main one of the two velocity components. The vertical lines on the individual data points show their uncertainties. The black line is the best linear fit for
) for the S242 main skeletons. The magenta dots represent the skeleton structures in both end-clumps, the green dots are other skeleton regions not located in the end regions, the open green circles represent the value in the length ranges of
~6.5–8.5 pc and 13.5–15.5 pc, which are calculated by the main one of the two velocity components. The vertical lines on the individual data points show their uncertainties. The black line is the best linear fit for
![]() and
and ![]() ; the fitted slope parameter (K) is 0.62 ± 0.07. The cyan lines show the characteristic of αvir = 2.0. Lower panel: Log-scale of αvir histograms for the S242 main skeleton, the S242 main skeleton with
; the fitted slope parameter (K) is 0.62 ± 0.07. The cyan lines show the characteristic of αvir = 2.0. Lower panel: Log-scale of αvir histograms for the S242 main skeleton, the S242 main skeleton with ![]() ≥ 1.0e22, and the S242 skeleton with
≥ 1.0e22, and the S242 skeleton with ![]() < 1.0e22, respectively. All histograms are weighted by the value of H2
column density.
< 1.0e22, respectively. All histograms are weighted by the value of H2
column density.
Current usage metrics show cumulative count of Article Views (full-text article views including HTML views, PDF and ePub downloads, according to the available data) and Abstracts Views on Vision4Press platform.
Data correspond to usage on the plateform after 2015. The current usage metrics is available 48-96 hours after online publication and is updated daily on week days.
Initial download of the metrics may take a while.