Fig. 4
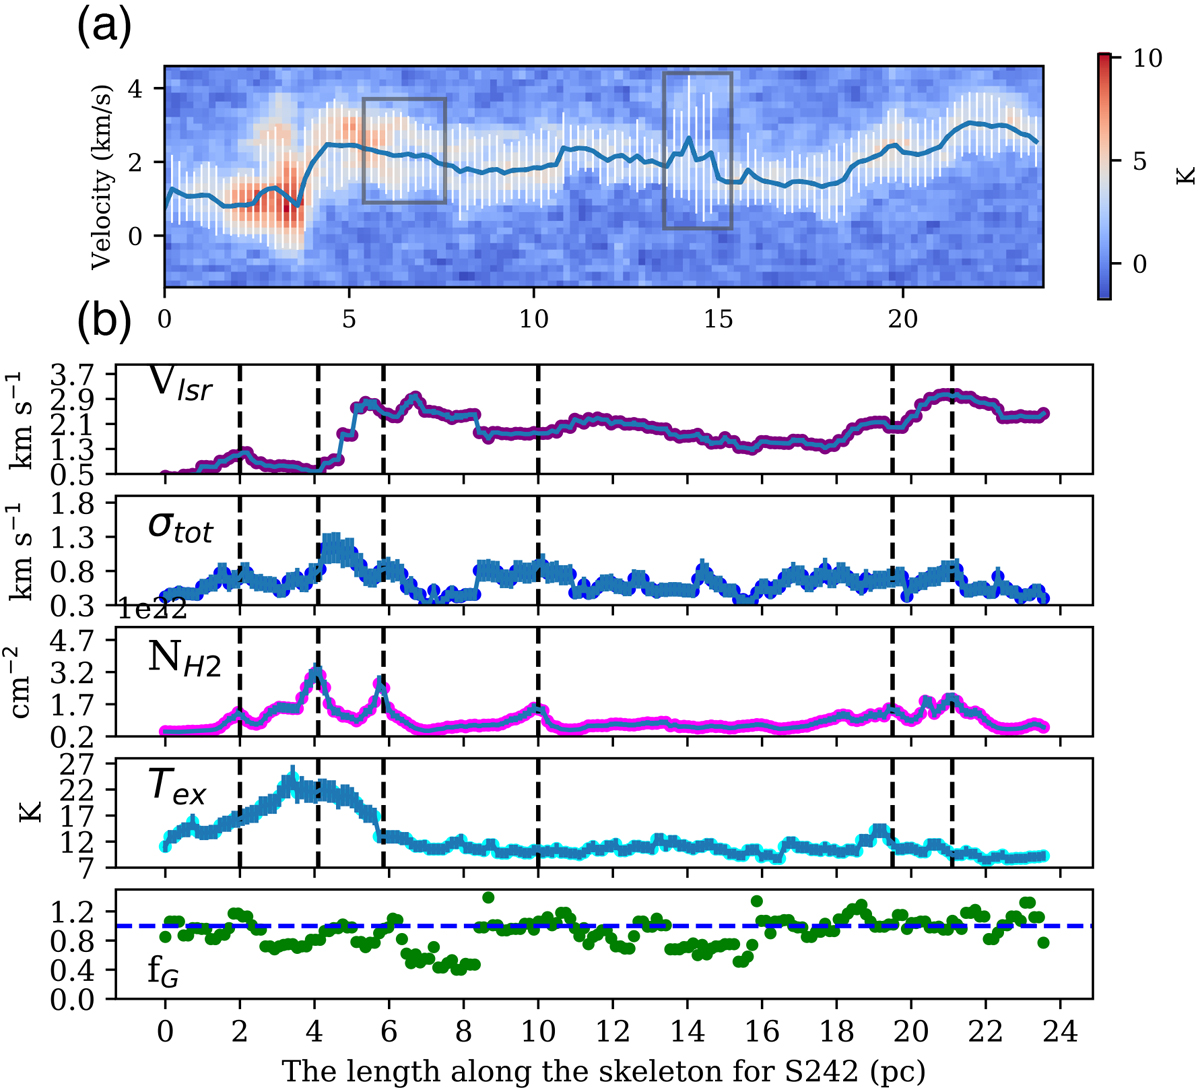
Panel a: position-velocity distribution along the spine of filament S242 from the southern to northern end. The dark blue curve and vertical white lines represent the fitted centroid velocity and FWHM velocity width by a single Gaussian, respectively. Panel b: centroid velocity (Vlsr), total 1D velocity dispersion (σtot), H2 column density (![]() ), excitation temperature (Tex), and the fraction intensity of the fitted main velocity components taken in the observed spectra (fG), distributed along the main skeleton of the filament S242. The vertical black dashed lines indicate the peaks of the H2 column density profile; the horizontal blue dashed line represents fG
= 1.
), excitation temperature (Tex), and the fraction intensity of the fitted main velocity components taken in the observed spectra (fG), distributed along the main skeleton of the filament S242. The vertical black dashed lines indicate the peaks of the H2 column density profile; the horizontal blue dashed line represents fG
= 1.
Current usage metrics show cumulative count of Article Views (full-text article views including HTML views, PDF and ePub downloads, according to the available data) and Abstracts Views on Vision4Press platform.
Data correspond to usage on the plateform after 2015. The current usage metrics is available 48-96 hours after online publication and is updated daily on week days.
Initial download of the metrics may take a while.