Fig. 3
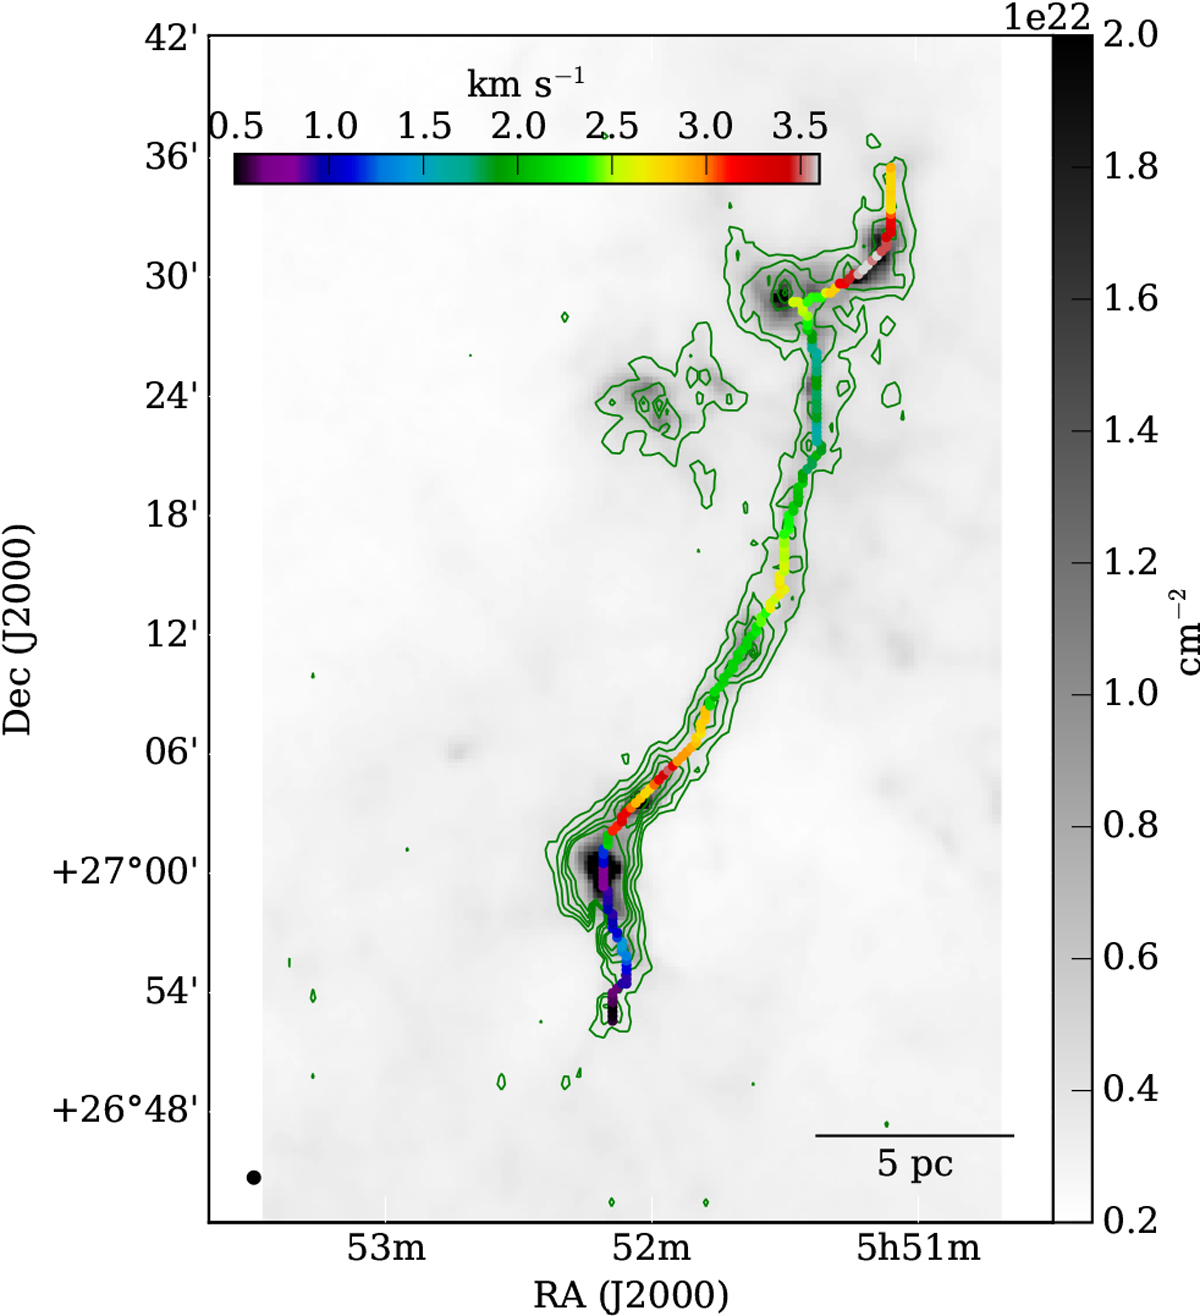
Skeletons of the filamentary network extracted with the FilFinder, color-coded by the centroid velocities of the 13CO spectral line.The gray map is the H2 column density map derived from Herschel continuum map (160–500 μm) in Dewangan et al. (2017). The overlaid green contours display 13CO column density distribution of filament S242, ranging from 15 to 90% stepped by 15% of the value (1.5 × 1016 cm−2).
Current usage metrics show cumulative count of Article Views (full-text article views including HTML views, PDF and ePub downloads, according to the available data) and Abstracts Views on Vision4Press platform.
Data correspond to usage on the plateform after 2015. The current usage metrics is available 48-96 hours after online publication and is updated daily on week days.
Initial download of the metrics may take a while.