Fig. 2
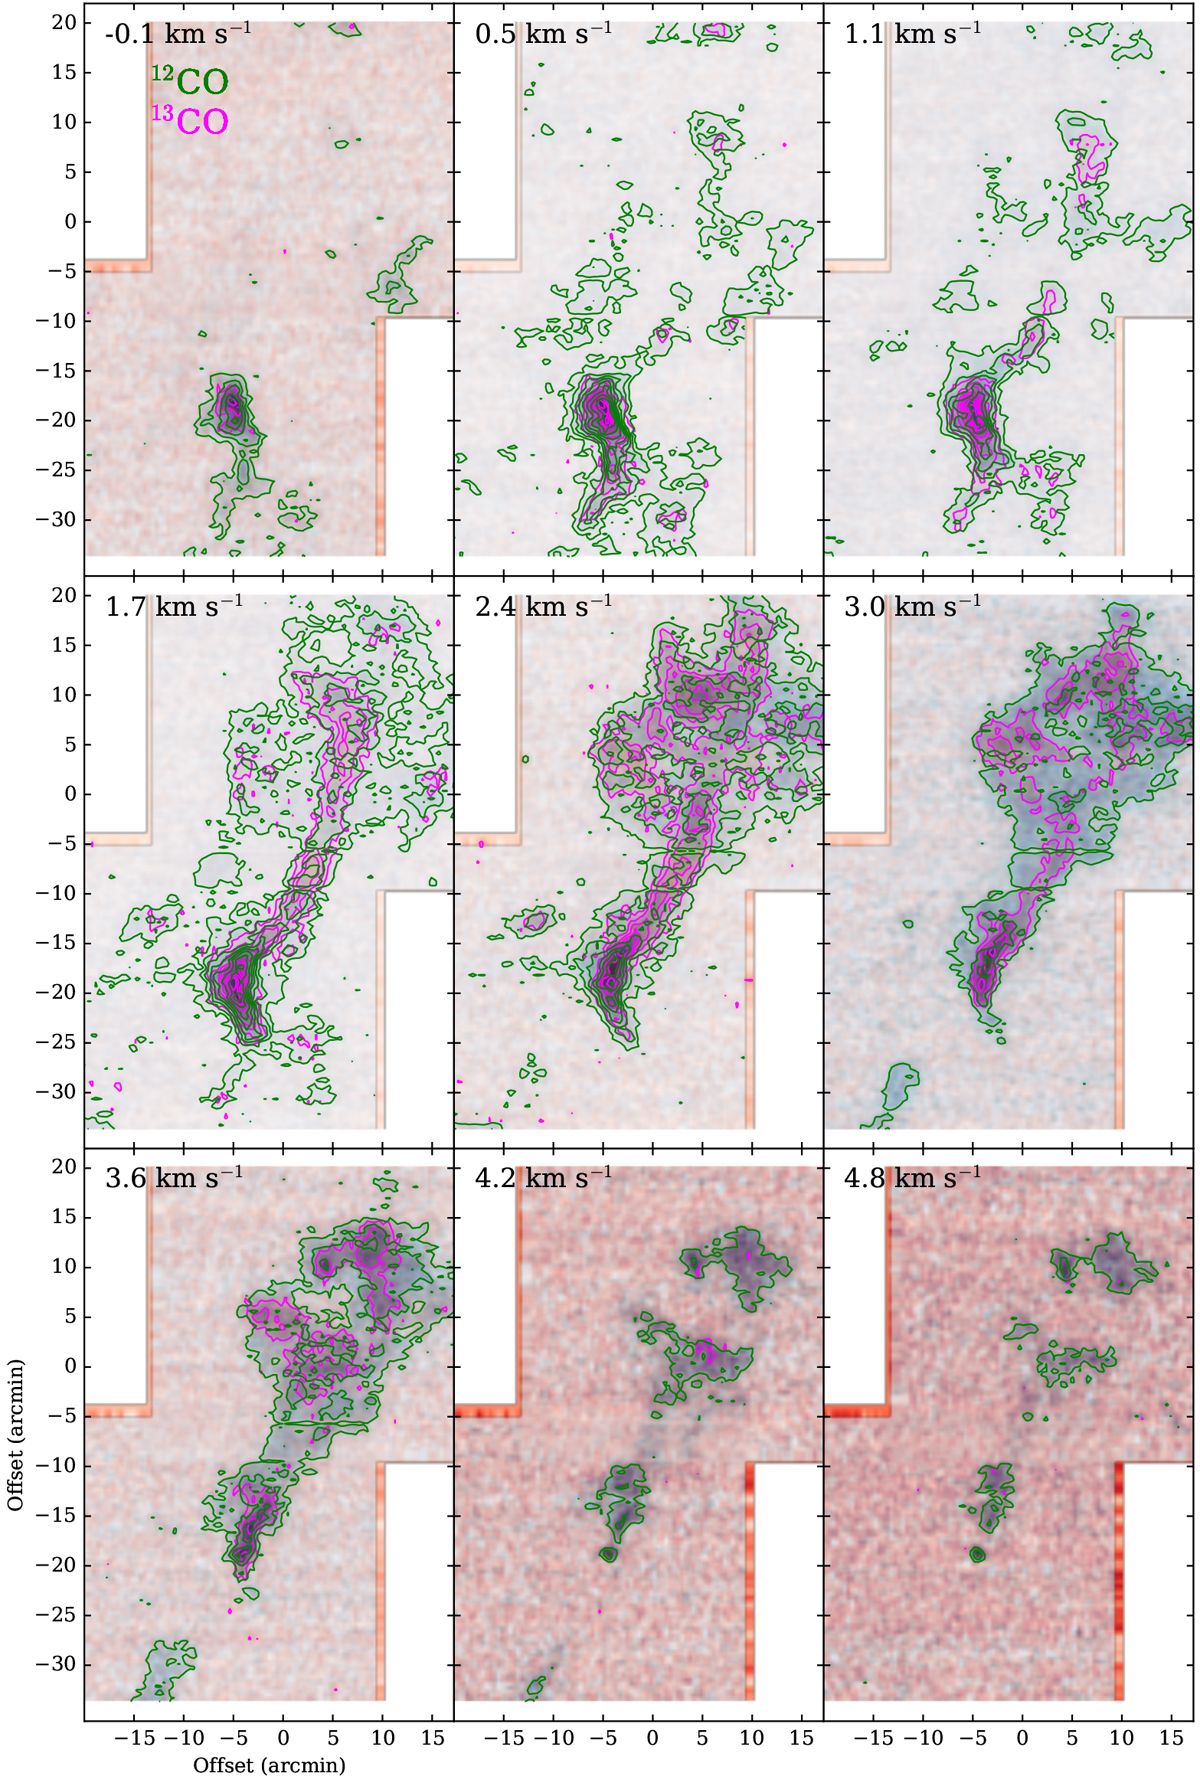
Channel maps of 12CO(1–0) and 13CO(1–0) lines. The green and magenta contours display the distribution of the integrated intensity 12CO(1–0) and 13CO(1–0) lines, respectively, in the interval velocity range of 0.6 km s−1. The levels of green contours are from 6σ (~1.2 K km s−1) to the peak value by intervals of 6σ. The levels of magenta contours are from 3σ (~0.6 K km s−1) to the peak value by intervals of 3σ.
Current usage metrics show cumulative count of Article Views (full-text article views including HTML views, PDF and ePub downloads, according to the available data) and Abstracts Views on Vision4Press platform.
Data correspond to usage on the plateform after 2015. The current usage metrics is available 48-96 hours after online publication and is updated daily on week days.
Initial download of the metrics may take a while.