Fig. A.3
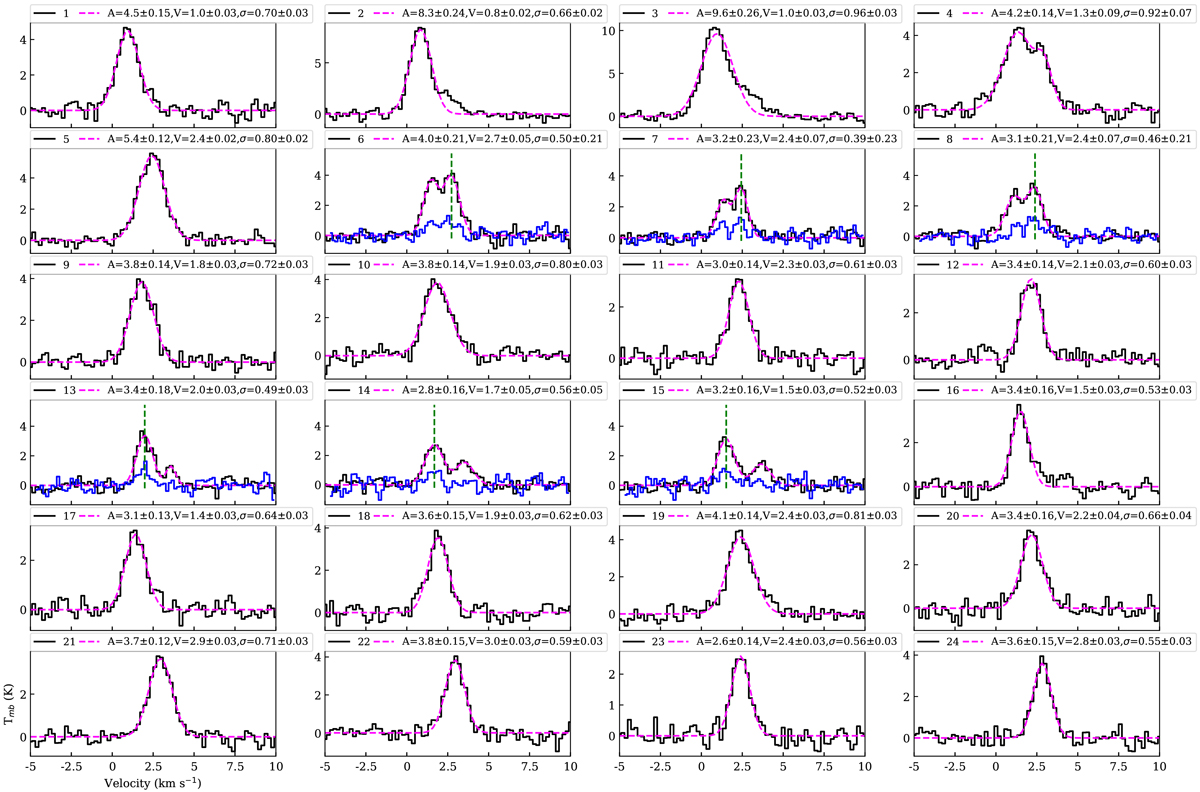
Average spectral profiles for 13CO lines in thecorresponding subregions from No.1 to No.24, displayed in Fig. A.2. The black profiles represent the observed spectra, the magenta dashed profiles are our fitted results by one or two Gaussians. The fitted parameters for the main velocity components (including peak intensity, centroid velocity, and velocity dispersion) are given at the top of every subpanel. The blue profiles in No. 6 – No. 8 and No. 13 – No. 15 are the average C18O line spectra, which are amplified by a factor of 3. These C18O data are from MWISP CO surveys (Su et al. 2019). In each of those panels, the vertical green dashed line shows the centroid velocity of the main velocity component.
Current usage metrics show cumulative count of Article Views (full-text article views including HTML views, PDF and ePub downloads, according to the available data) and Abstracts Views on Vision4Press platform.
Data correspond to usage on the plateform after 2015. The current usage metrics is available 48-96 hours after online publication and is updated daily on week days.
Initial download of the metrics may take a while.