Fig. 1
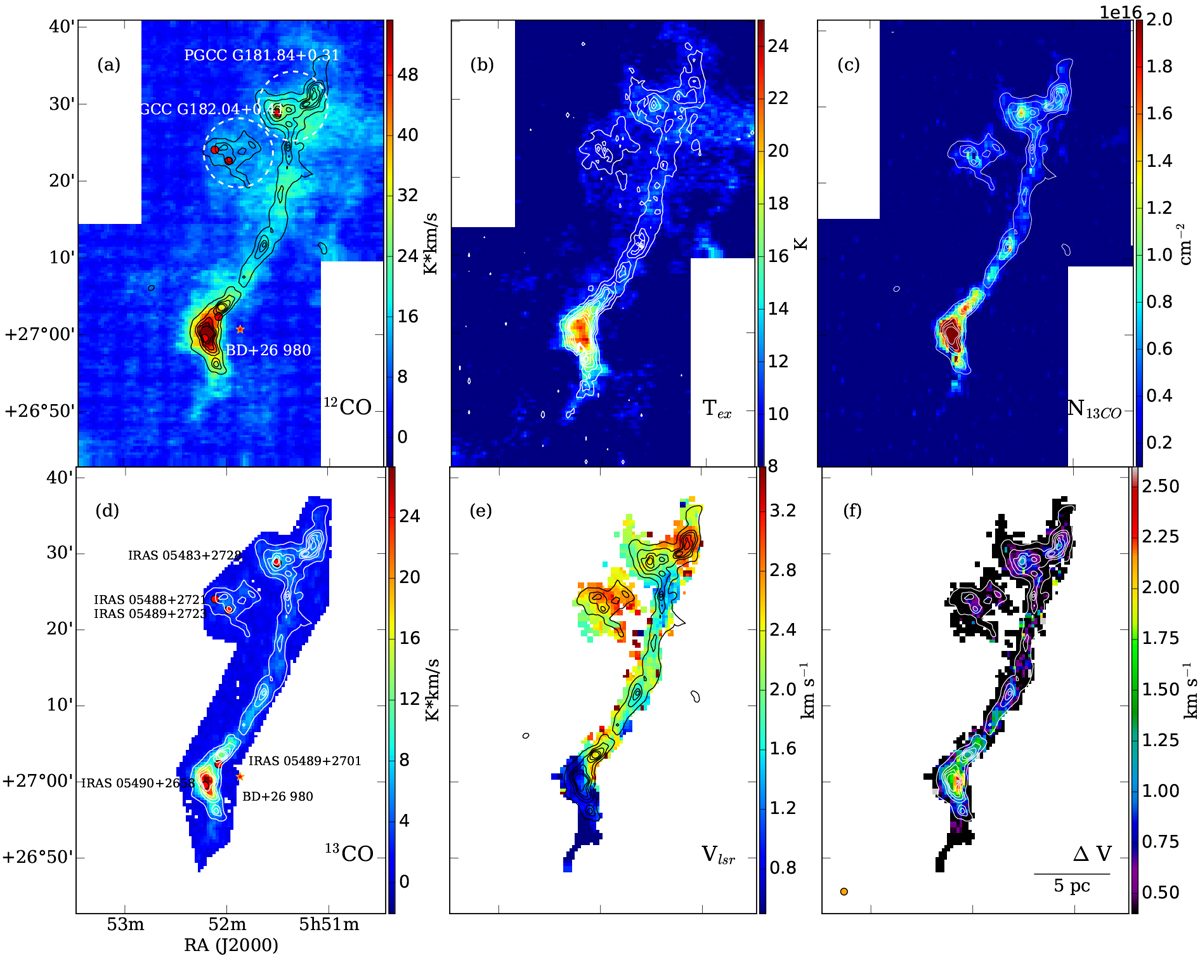
Panels a and d: color-scale images represent the distributions of the integrated intensity for 12CO(1–0) and 13CO(1–0) lines in the velocity range of −5 to 10 km s−1. The red circles denote the IRAS sources in the filament S242. The orange star represents the star BD+26 980, which triggers the HII region associated with the S242-S region. The white dashed circles indicate the Planck Galactic cold clumps G181.84+0.31 and G182.04+0.41. The black and white contours in all the panels, except for panel b, display the H2 column density distribution of S242, which derived as Dewangan et al. (2017), ranging from 25 to 90% stepped by 15% of the value (2.0 × 1022 cm−2). Panel b: excitation temperature map derived from 12CO(1–0) line. The white contours display 13CO column density distribution of S242, ranging from 10 to 90% stepped by 15% of the value (2.0 × 1016 cm−2). Panel c: 13CO column density map. Panel e: centroid velocity field of S242, which derived from the Gaussian fitting of 13CO(1–0) line. Panel f: distribution of FWHM velocity width for S242, which derived from the Gaussian fitting of 13CO(1–0) line. The orange circle in panel f shows the effective beam size of TRAO.
Current usage metrics show cumulative count of Article Views (full-text article views including HTML views, PDF and ePub downloads, according to the available data) and Abstracts Views on Vision4Press platform.
Data correspond to usage on the plateform after 2015. The current usage metrics is available 48-96 hours after online publication and is updated daily on week days.
Initial download of the metrics may take a while.