Fig. 7.
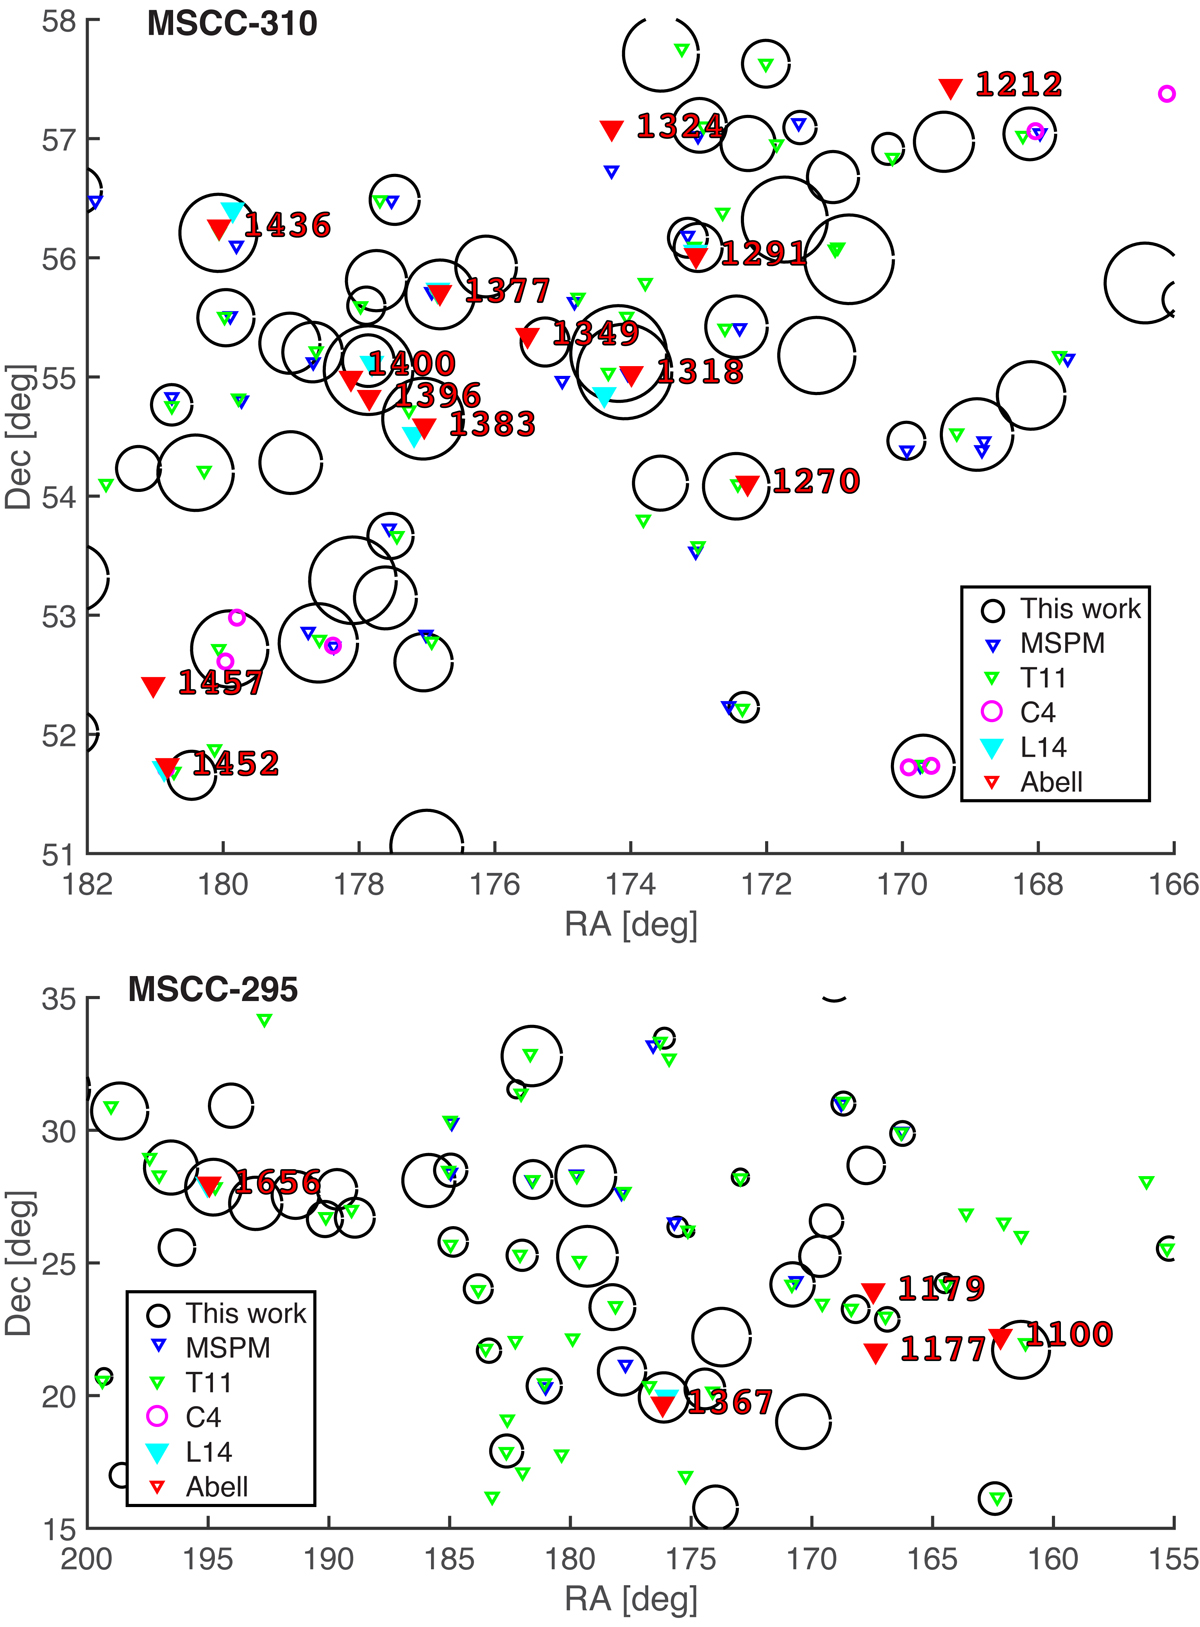
Projected distribution in the sky of systems detected by GSyF. Top: systems detected for the MSCC 310 (UMa supercluster). Bottom: systems detected for the MSCC 295 (Coma supercluster). The system radii are shown as circles of r = Rvir. For comparison, the positions of systems reported by MSPM, T11, C4, L14, and Abell catalogs are depicted by color points: blue, green, pink, cyan, and red, respectively.
Current usage metrics show cumulative count of Article Views (full-text article views including HTML views, PDF and ePub downloads, according to the available data) and Abstracts Views on Vision4Press platform.
Data correspond to usage on the plateform after 2015. The current usage metrics is available 48-96 hours after online publication and is updated daily on week days.
Initial download of the metrics may take a while.