Fig. 3.
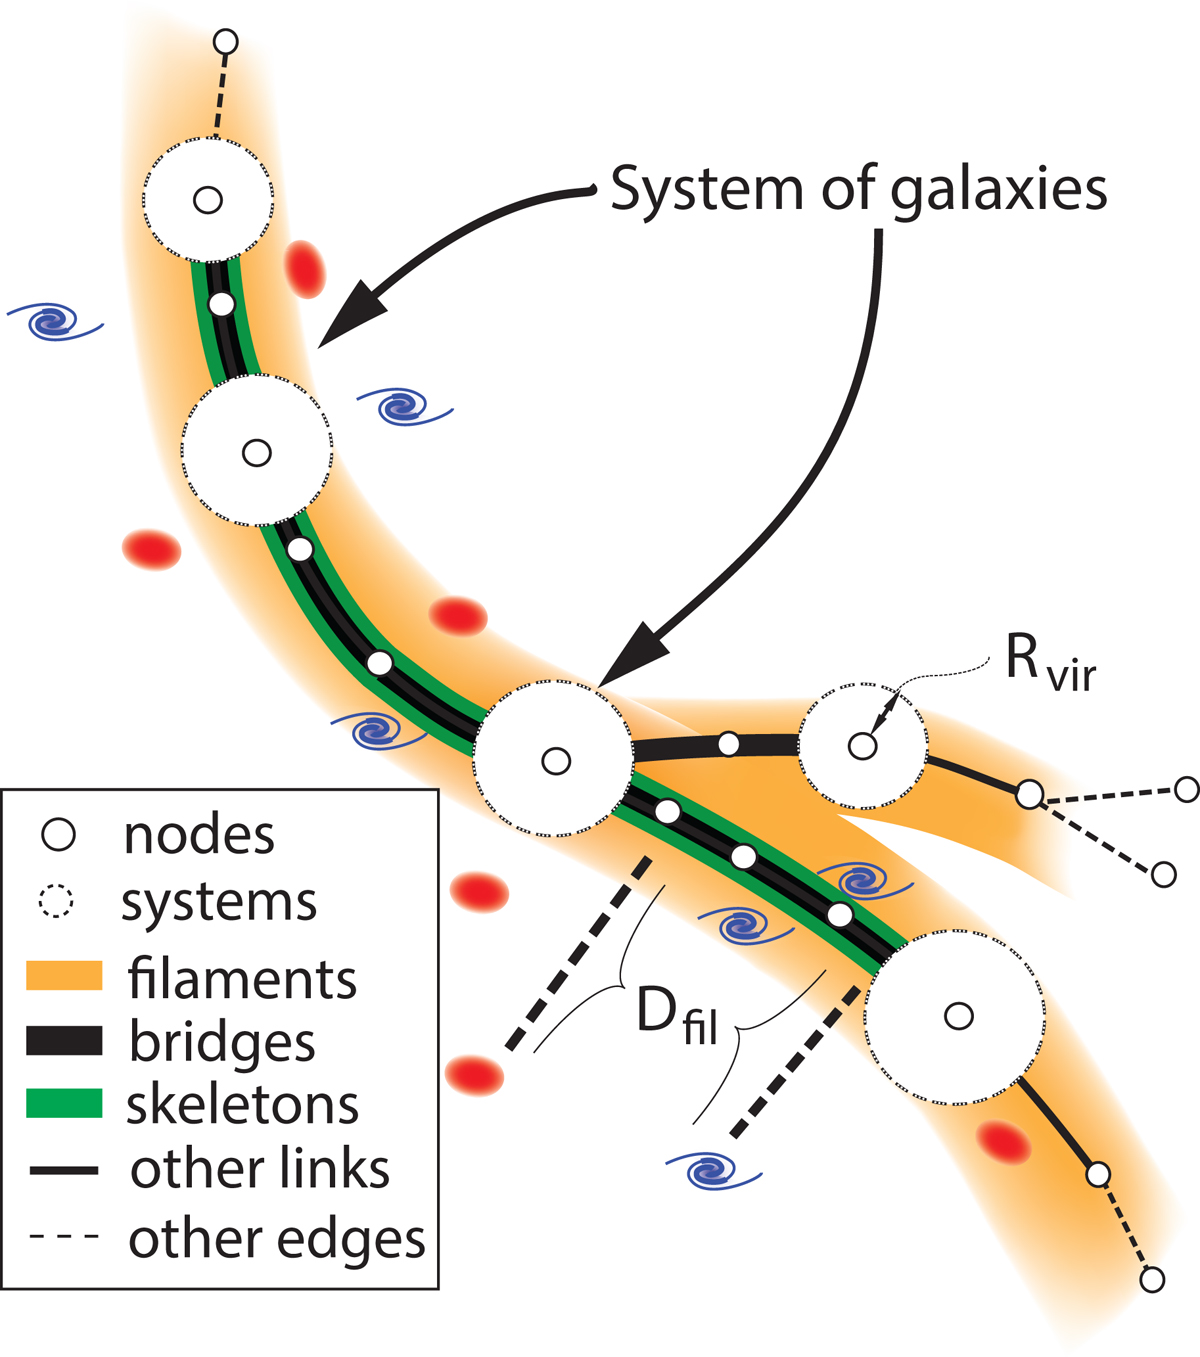
Representation of a filament. Graph nodes are represented by white circles and edges by dark lines. The five systems connected are represented by a dotted circle of radius Rvir. A bridge connecting two systems is represented as a bold black line. The distance from galaxies to the filament (bold dashed line) is measured along a line perpendicular to the edges.
Current usage metrics show cumulative count of Article Views (full-text article views including HTML views, PDF and ePub downloads, according to the available data) and Abstracts Views on Vision4Press platform.
Data correspond to usage on the plateform after 2015. The current usage metrics is available 48-96 hours after online publication and is updated daily on week days.
Initial download of the metrics may take a while.