Fig. 14.
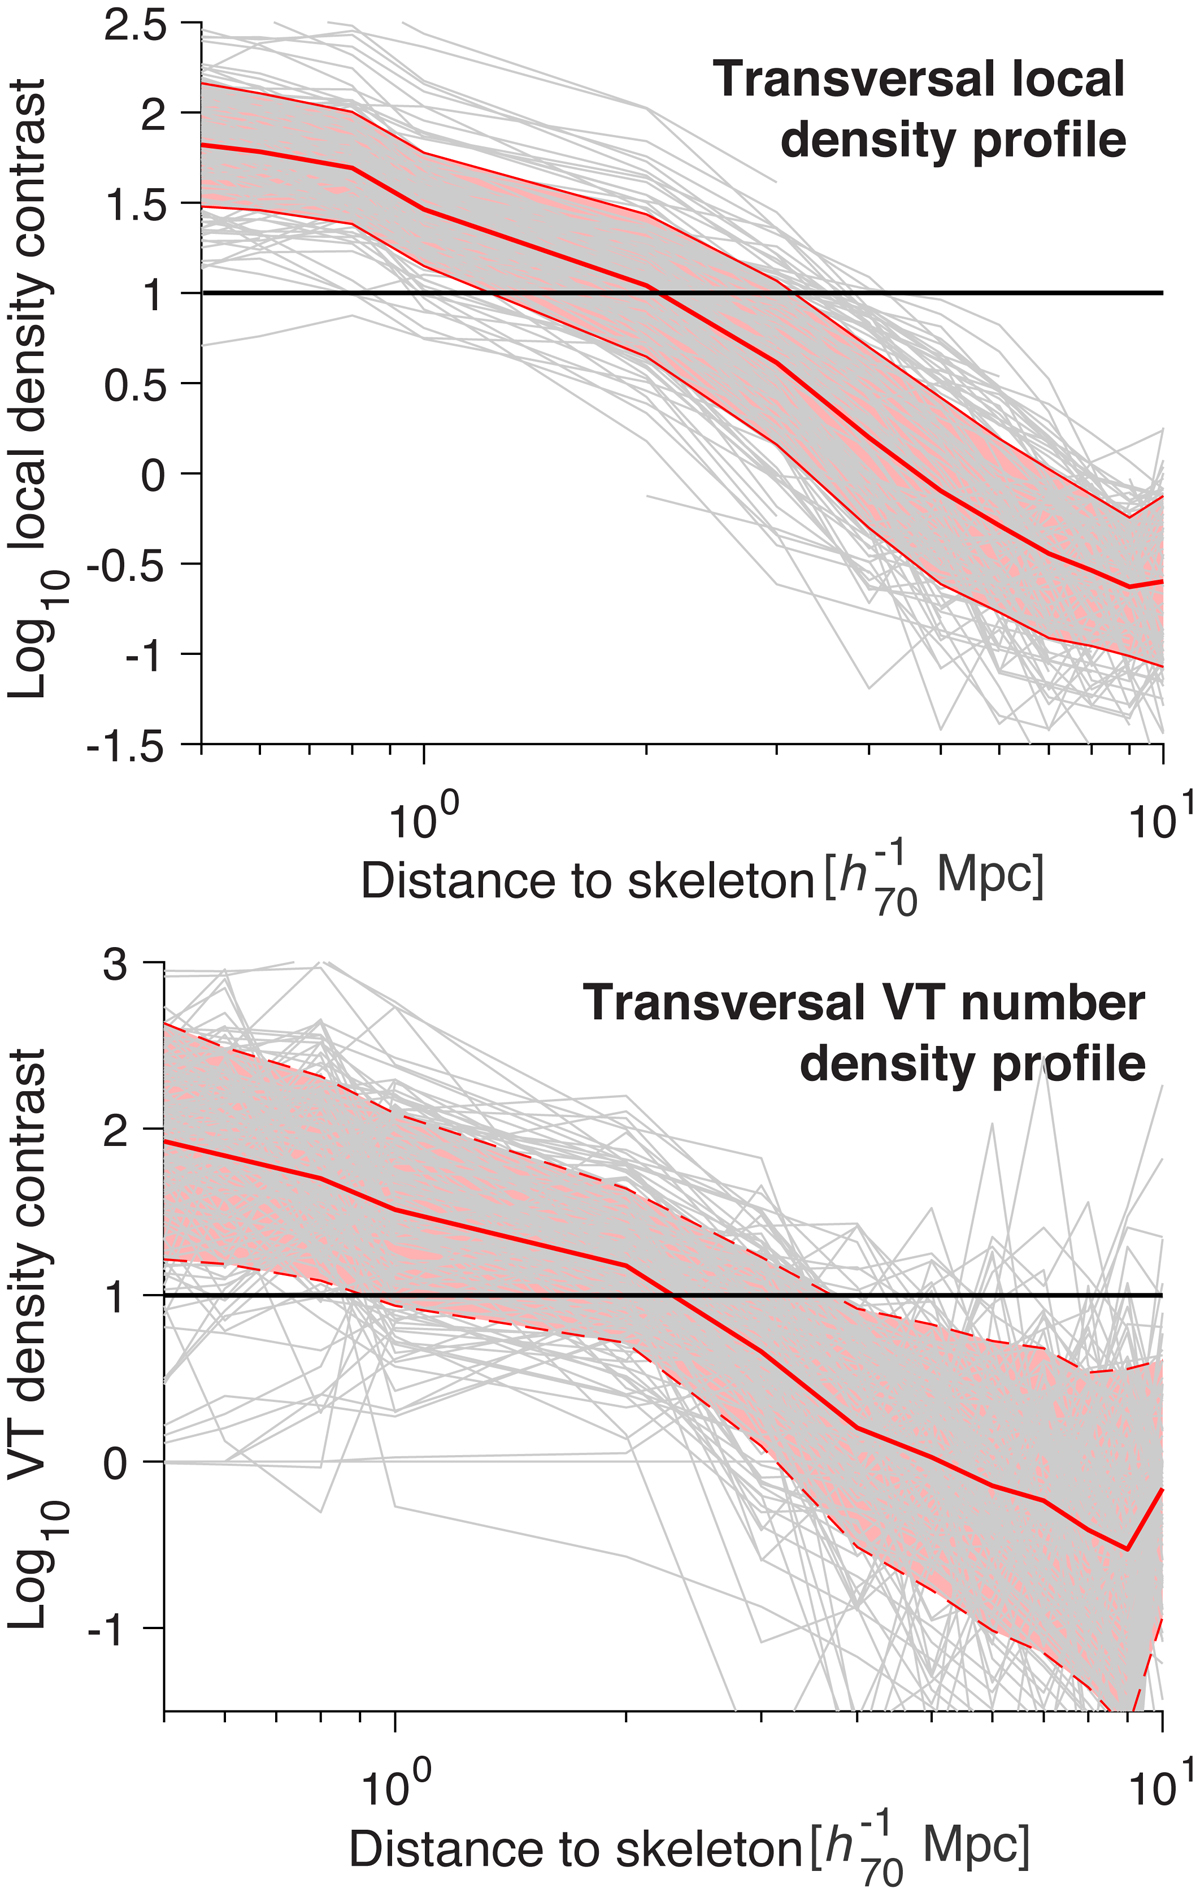
Stacked number density profiles for the 144 filaments identified by GFiF. Individual profiles are represented by thin gray lines. Top: the red lines corresponds to the mean local density (stacked) profile. Bottom: mean VT density stacked profile. The solid line indicates the mean profile while the shaded area represents the dispersion of the profile. Solid black line depicts the density contrast of 10 × d.
Current usage metrics show cumulative count of Article Views (full-text article views including HTML views, PDF and ePub downloads, according to the available data) and Abstracts Views on Vision4Press platform.
Data correspond to usage on the plateform after 2015. The current usage metrics is available 48-96 hours after online publication and is updated daily on week days.
Initial download of the metrics may take a while.