Fig. 9.
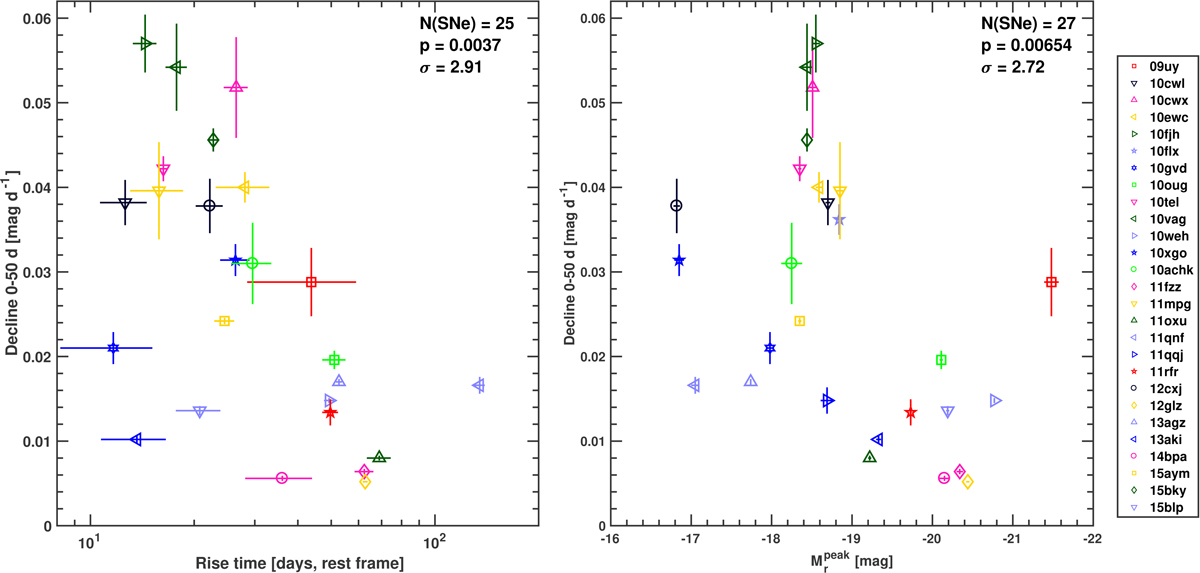
Examination of possible correlations between decline rates versus rise times and peak absolute magnitudes, respectively, of the sample SNe (Sect. 4.4). Photometric bands are as specified in Table 6. In each panel the Spearman correlation coefficient p, the corresponding significance σ and the number of SNe, N(SNe), are shown.
Current usage metrics show cumulative count of Article Views (full-text article views including HTML views, PDF and ePub downloads, according to the available data) and Abstracts Views on Vision4Press platform.
Data correspond to usage on the plateform after 2015. The current usage metrics is available 48-96 hours after online publication and is updated daily on week days.
Initial download of the metrics may take a while.