Fig. 7.
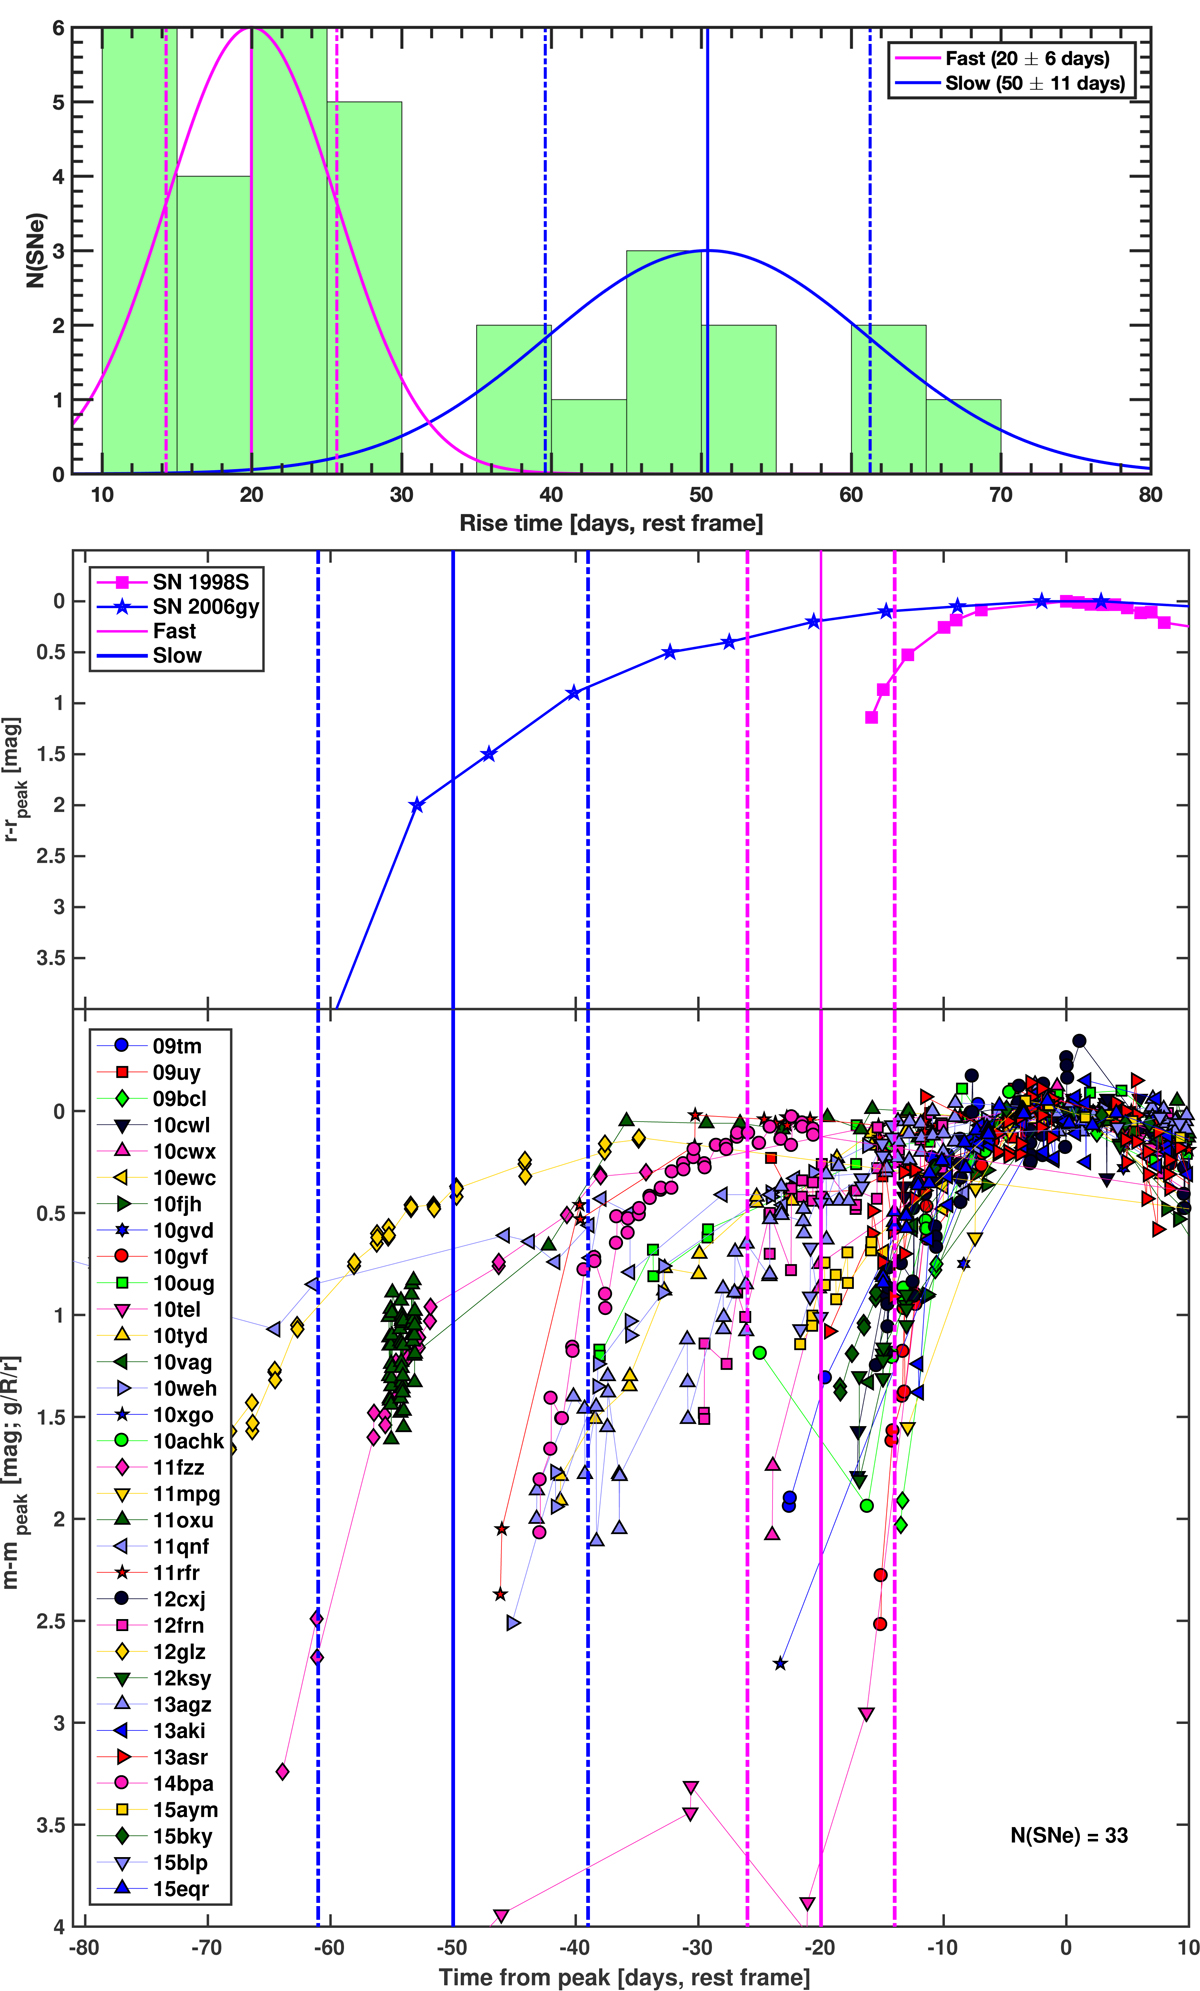
Top panel: histogram for the rise times for 32 of our SNe IIn. Our SNe IIn are divided into fast (magenta lines) and slow (blue lines) risers, with rise times 20 ± 6 d and 50 ± 11 d, respectively (as identified with GMM). Dashed lines show 1σ of the Gaussians. For reasons discussed in Sect. 5.3, we excluded PTF11qnf from the GMM analysis. Central panel: rise times of the two clusters of SNe IIn (slow and fast risers) compared to two well-known slow and fast risers from the literature (SN 2006gy, Smith et al. 2007; SN 1998S, Liu et al. 2000), with the rise-time ranges from the top panel overplotted. Bottom panel: light-curves of all the N(SNe) = 33 SNe in our sample with well-determined peak times matched at peak brightness (here, we include PTF11qnf for completeness).
Current usage metrics show cumulative count of Article Views (full-text article views including HTML views, PDF and ePub downloads, according to the available data) and Abstracts Views on Vision4Press platform.
Data correspond to usage on the plateform after 2015. The current usage metrics is available 48-96 hours after online publication and is updated daily on week days.
Initial download of the metrics may take a while.