Fig. 4.
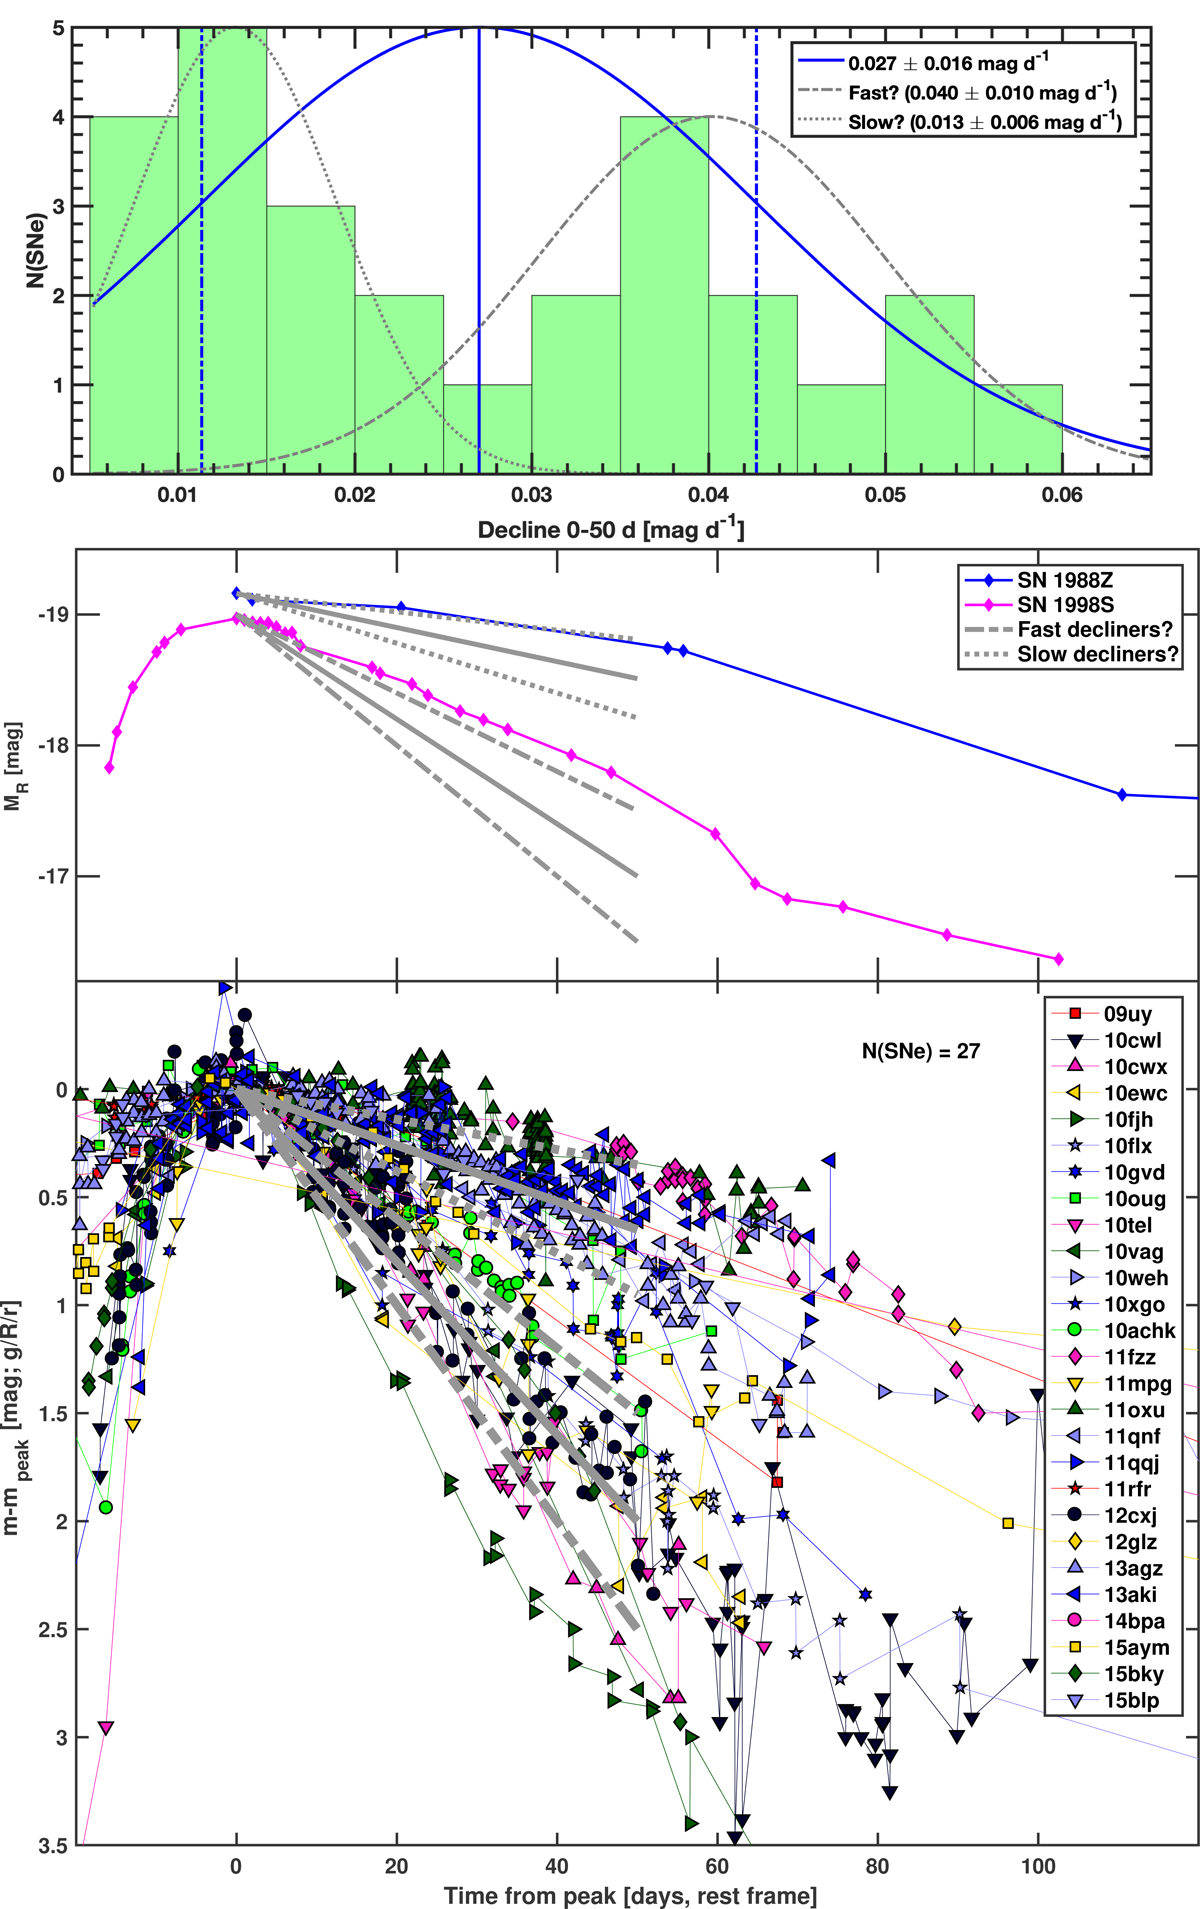
Top panel: histogram for the decline rates between 0 and 50 d after peak brightness for 27 of our SNe IIn. A single Gaussian (identified using GMM with BIC) describing the whole population is shown in blue, but our SNe IIn might possibly divide into fast (grey dash-dot lines) and slow (grey dotted lines) decliners, with slopes 0.040 ± 0.010 mag d−1 and 0.013 ± 0.006 mag d−1, respectively (suggested by GMM with AIC). The respective mean decline rates are shown as solid grey lines. Central panel: two possible clusters of SNe IIn (slow and fast decliners) compared to the prototypical slow and fast decliners from the literature (SN 1988Z, Aretxaga et al. 1999; SN 1998S, Liu et al. 2000). Bottom panel: light-curves of the N(SNe) = 27 of our SNe IIn with measured decline rates (between 0 and 50 d), scaled to match at peak. The two different decline rates are overplotted. Fast (grey dash-dot lines) and slow (grey dotted lines) decliners are shown, with the respective mean decline rates marked with solid grey lines.
Current usage metrics show cumulative count of Article Views (full-text article views including HTML views, PDF and ePub downloads, according to the available data) and Abstracts Views on Vision4Press platform.
Data correspond to usage on the plateform after 2015. The current usage metrics is available 48-96 hours after online publication and is updated daily on week days.
Initial download of the metrics may take a while.