Fig. 3.
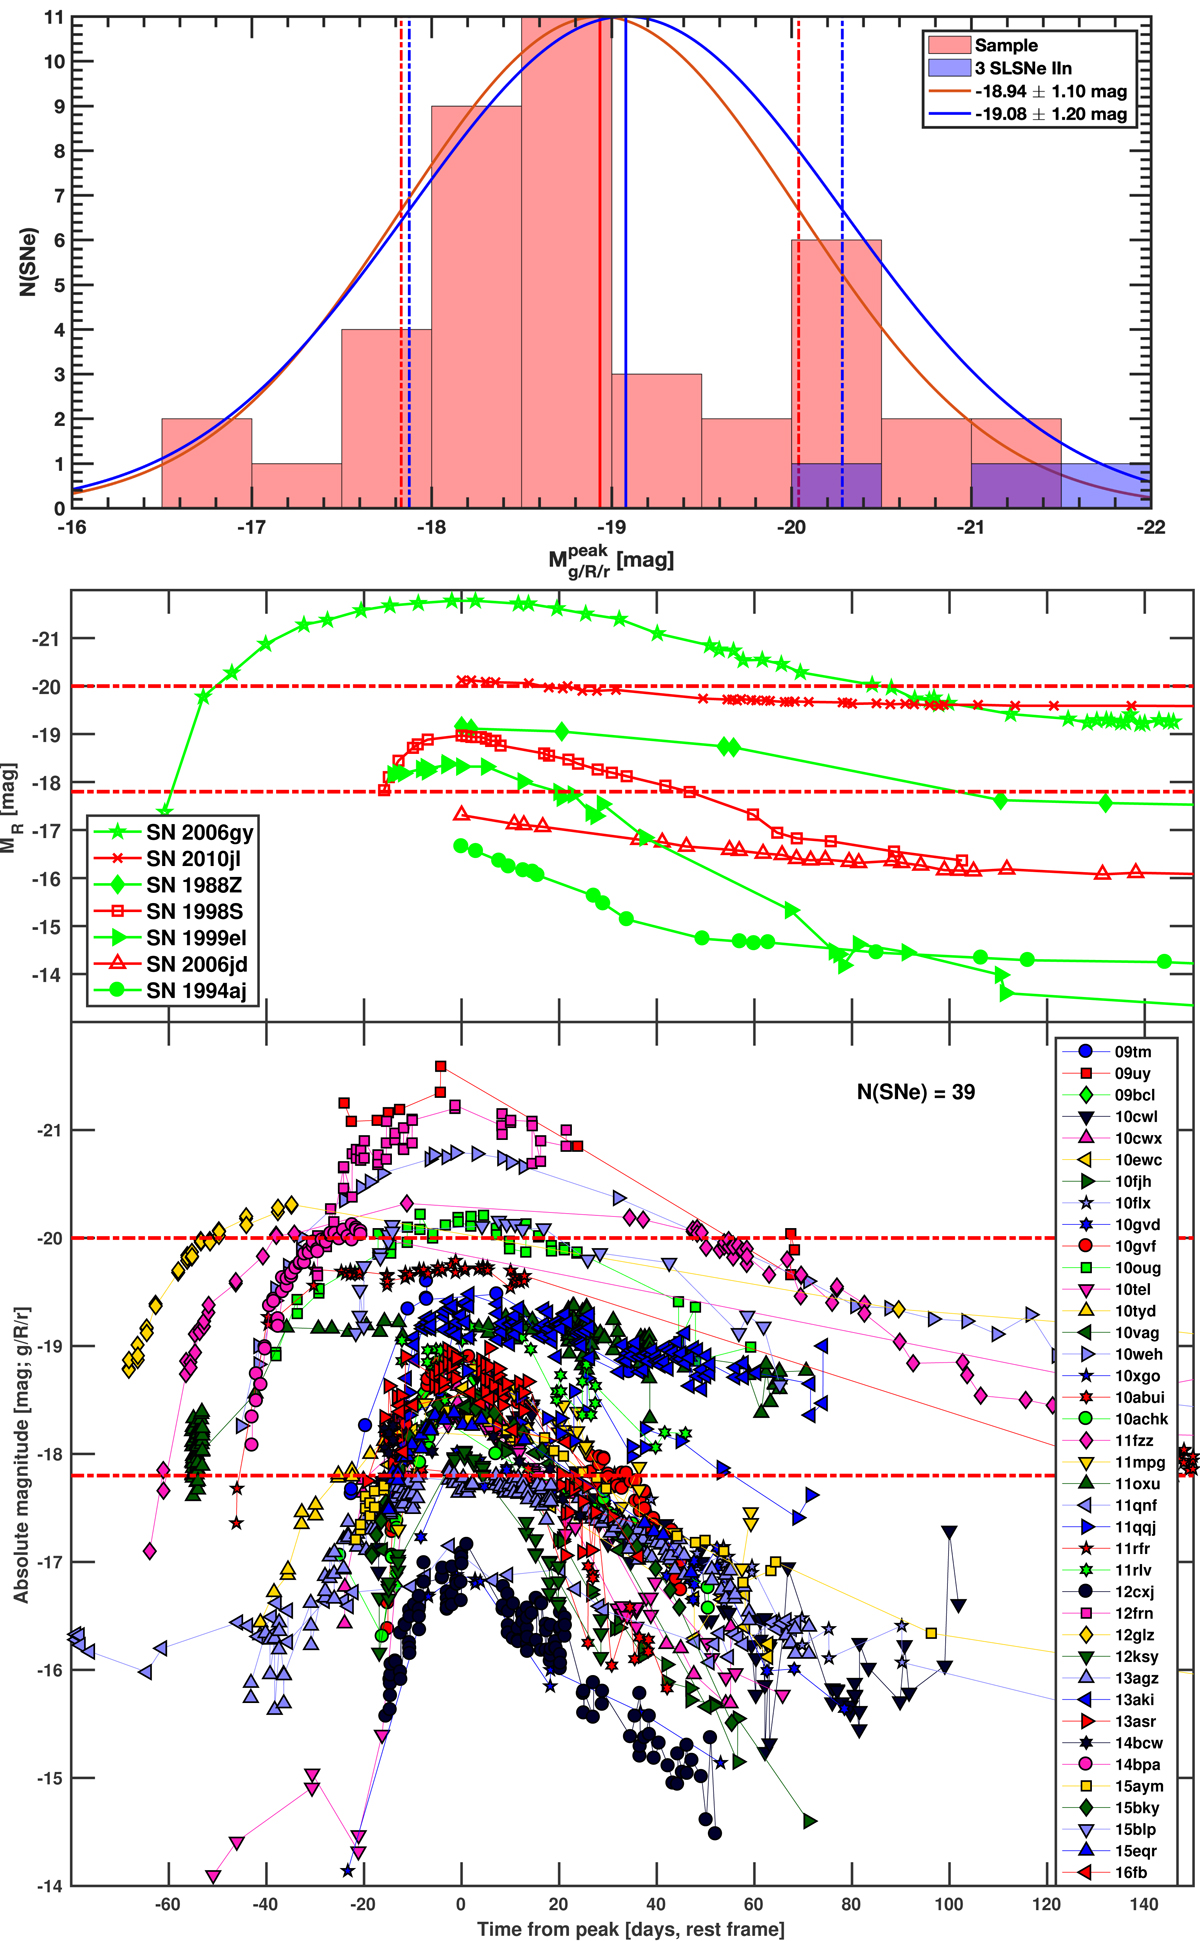
Top panel: histogram for the peak absolute magnitudes of our 42+3 SNe IIn, overplotted with the best-fit Gaussian distributions as identified with GMM. The Gaussian describing the distribution for the sample of 42 SNe is shown in red, the Gaussian for the sample 42 SNe IIn + 3 SLSNe IIn is shown in blue. Dash-dot lines show the 1σ values for the respective Gaussians. Central panel: some well-studied SNe IIn from the literature, showing photometry of SN 1988Z (Aretxaga et al. 1999), SN 1994aj (Benetti et al. 1998), SN 1998S (Liu et al. 2000), SN 1999el (Di Carlo et al. 2002), SN 2006gy (Smith et al. 2007), SN 2006jd (Stritzinger et al. 2012), and SN 2010jl (Fransson et al. 2014), with −17.8 mag and −20.0 mag (1σ values from the sample distribution) shown as dash-dot red lines. Bottom panel: absolute magnitudes of the N(SNe) = 39 SNe IIn with determined peak epochs as a function of time relative to light-curve peak (with sample 1σ values shown as dashed red lines). No K-corrections were applied in these plots.
Current usage metrics show cumulative count of Article Views (full-text article views including HTML views, PDF and ePub downloads, according to the available data) and Abstracts Views on Vision4Press platform.
Data correspond to usage on the plateform after 2015. The current usage metrics is available 48-96 hours after online publication and is updated daily on week days.
Initial download of the metrics may take a while.