Fig. B.1.
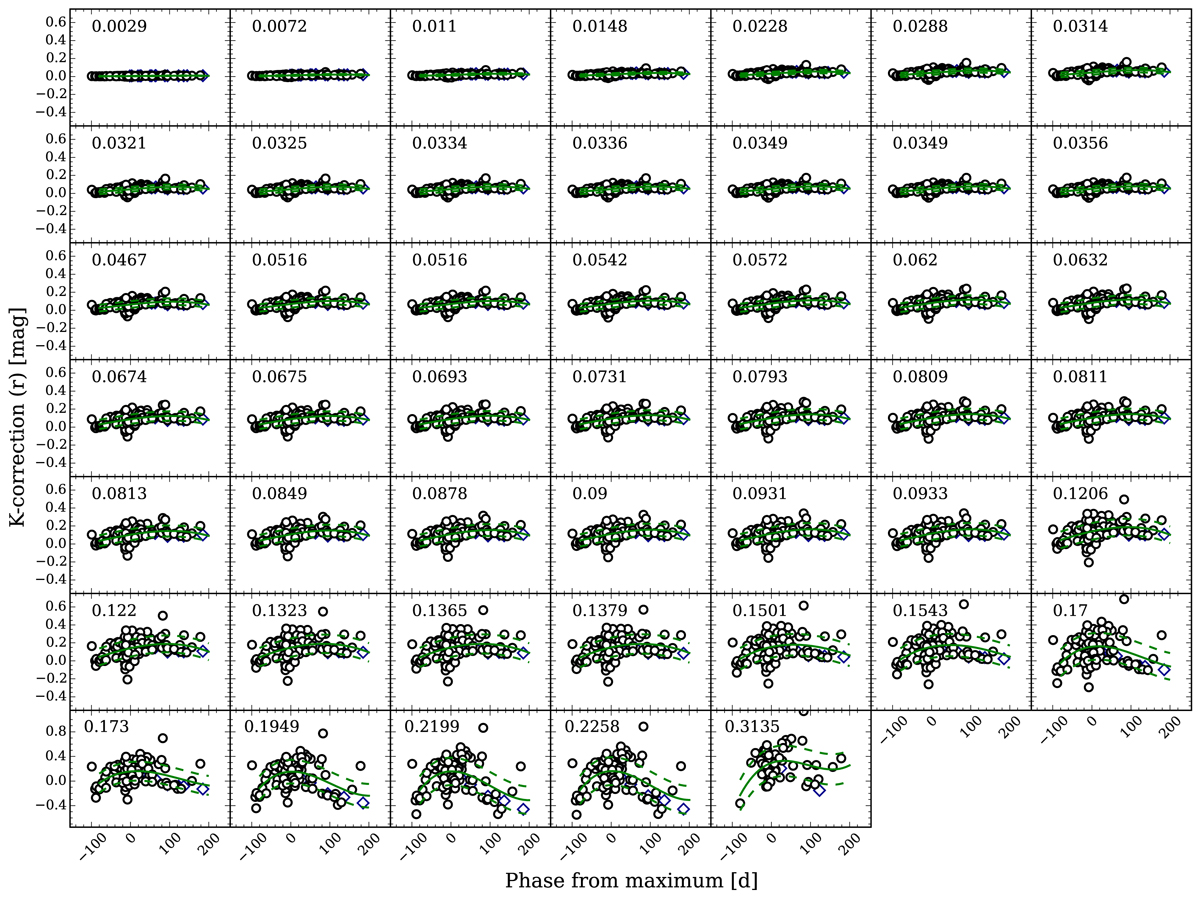
K-corrections in the r-band for SNe IIn at different redshifts. Blue points are the corrections computed for well-studied SNe IIn available in the literature (see the text for more details). Green lines are the best-fit models obtained using third-order polynomials, while dashed lines are the 1σ uncertainties of each fit. Phases (rest frame) refer to the estimated light-curve peak (Sect. 4.1 and Table 6) of each SN in the sample.
Current usage metrics show cumulative count of Article Views (full-text article views including HTML views, PDF and ePub downloads, according to the available data) and Abstracts Views on Vision4Press platform.
Data correspond to usage on the plateform after 2015. The current usage metrics is available 48-96 hours after online publication and is updated daily on week days.
Initial download of the metrics may take a while.