Fig. A.4.
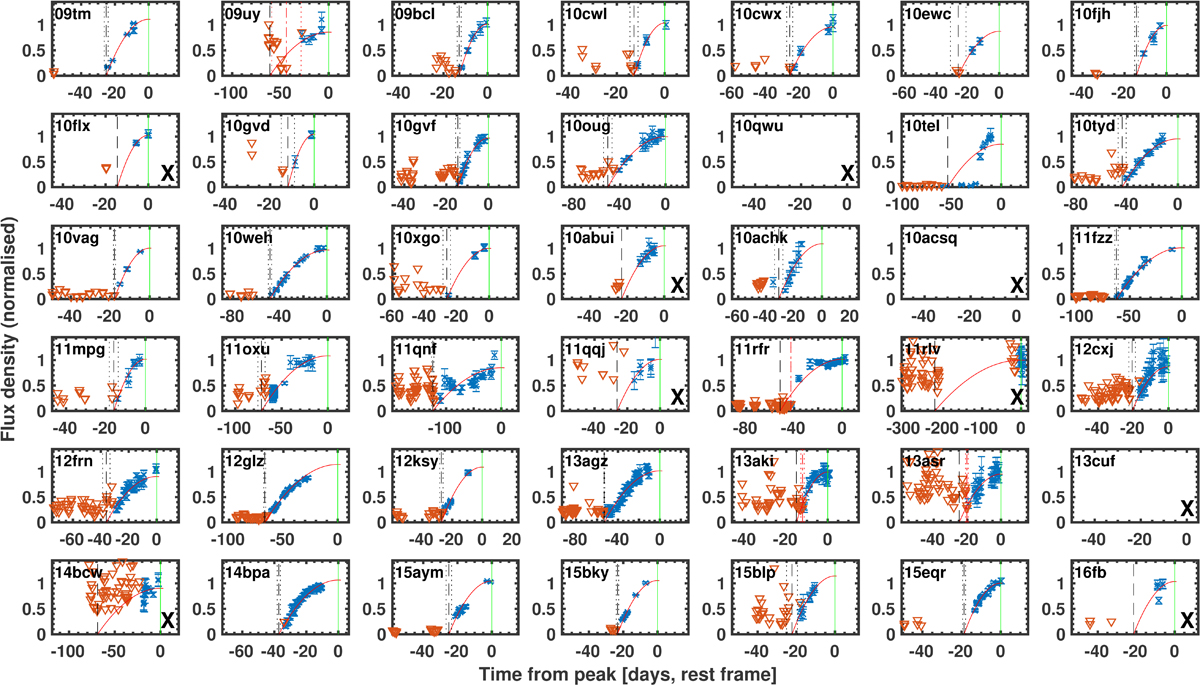
Fits of the ∝t2 template to determine the rise times of the SNe in our sample. Photometric bands are as specified in Table 6. The black dashed vertical line shows where the ∝t2 template reaches 0 flux density (with 1σ uncertainties given as black dotted lines). The red dashed vertical line shows where the explosion epoch estimate is based on the occurrence of an upper limit inconsistent with the ∝t2 template (with uncertainties given as red dotted lines). The SNe with “X” in their plots are not used for the rise-time measurements, according to criteria given in Sect. 4.3. For the SNe with peak-epoch error > 10 d (PTF10qwu, PTF10acsq, iPTF13cuf), our method does not allow any rise-time determination; these SNe are not shown.
Current usage metrics show cumulative count of Article Views (full-text article views including HTML views, PDF and ePub downloads, according to the available data) and Abstracts Views on Vision4Press platform.
Data correspond to usage on the plateform after 2015. The current usage metrics is available 48-96 hours after online publication and is updated daily on week days.
Initial download of the metrics may take a while.