Free Access
Fig. 2.
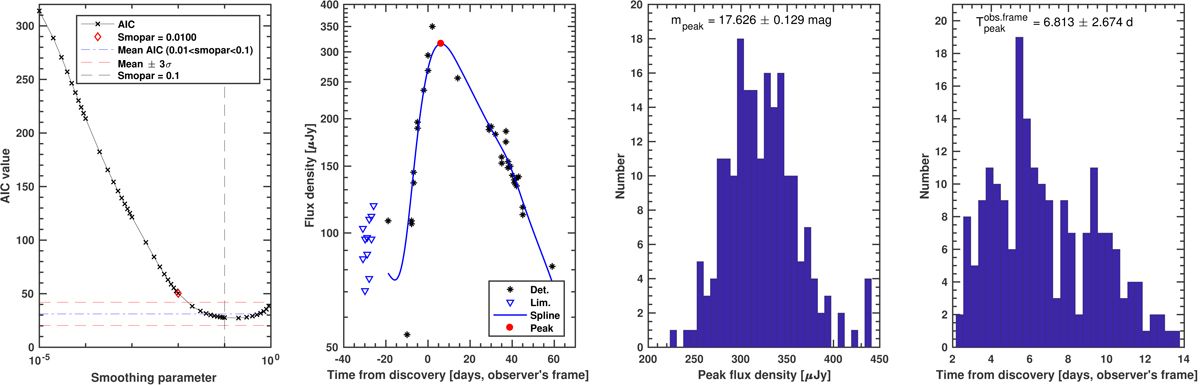
Left to right: AIC values as a function of the smoothing parameter of the attempted spline fits, light-curve (in flux density), peak flux density (Monte Carlo histogram), and peak time (Monte Carlo histogram) example for PTF10achk.
Current usage metrics show cumulative count of Article Views (full-text article views including HTML views, PDF and ePub downloads, according to the available data) and Abstracts Views on Vision4Press platform.
Data correspond to usage on the plateform after 2015. The current usage metrics is available 48-96 hours after online publication and is updated daily on week days.
Initial download of the metrics may take a while.