Fig. A.3.
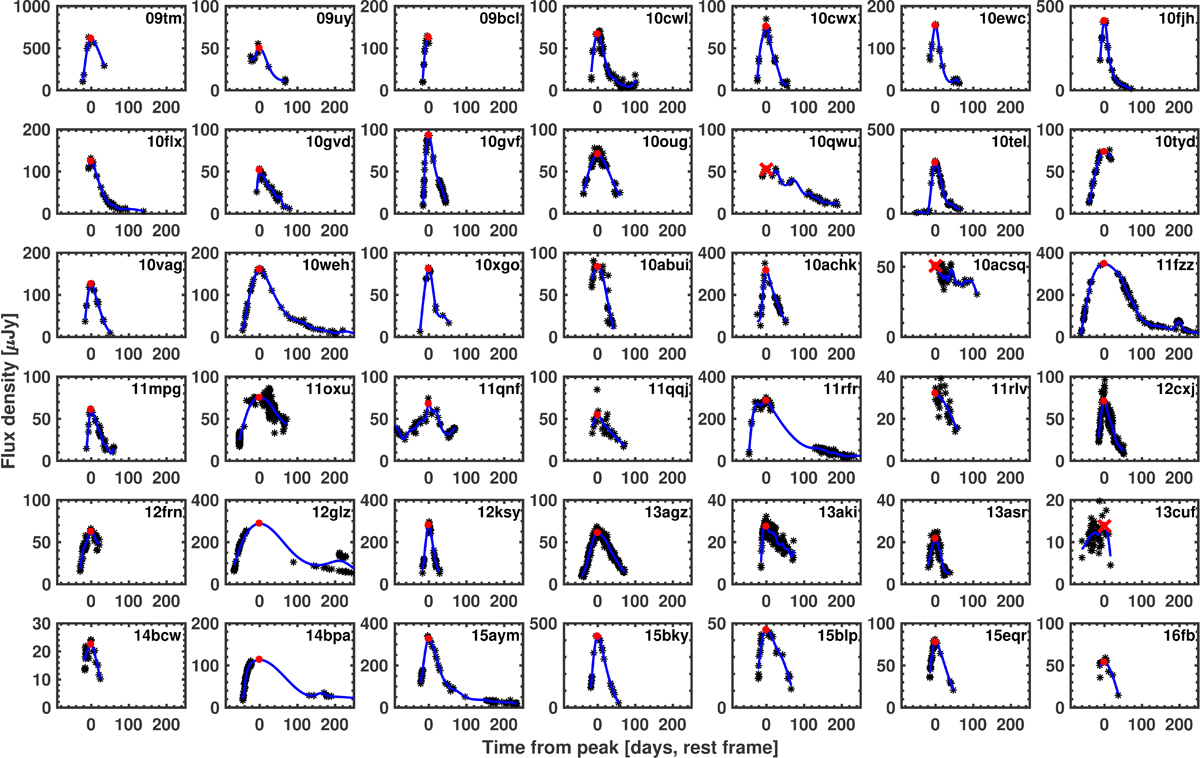
Cubic smoothing splines fit to our SN IIn light-curves, to determine the times and magnitudes of the light-curve peaks (Sect. 4.1). Photometric bands are specified in Table 6. The CSS fit is indicated by a blue curve and the peak of the light-curve is marked by a red dot. The smoothing parameter s for each SN is reported in Table 6. The SNe with peak-time error > 10 d (PTF10qwu, PTF10acsq, iPTF13cuf) have their estimated peaks marked with red crosses.
Current usage metrics show cumulative count of Article Views (full-text article views including HTML views, PDF and ePub downloads, according to the available data) and Abstracts Views on Vision4Press platform.
Data correspond to usage on the plateform after 2015. The current usage metrics is available 48-96 hours after online publication and is updated daily on week days.
Initial download of the metrics may take a while.