Fig. 16.
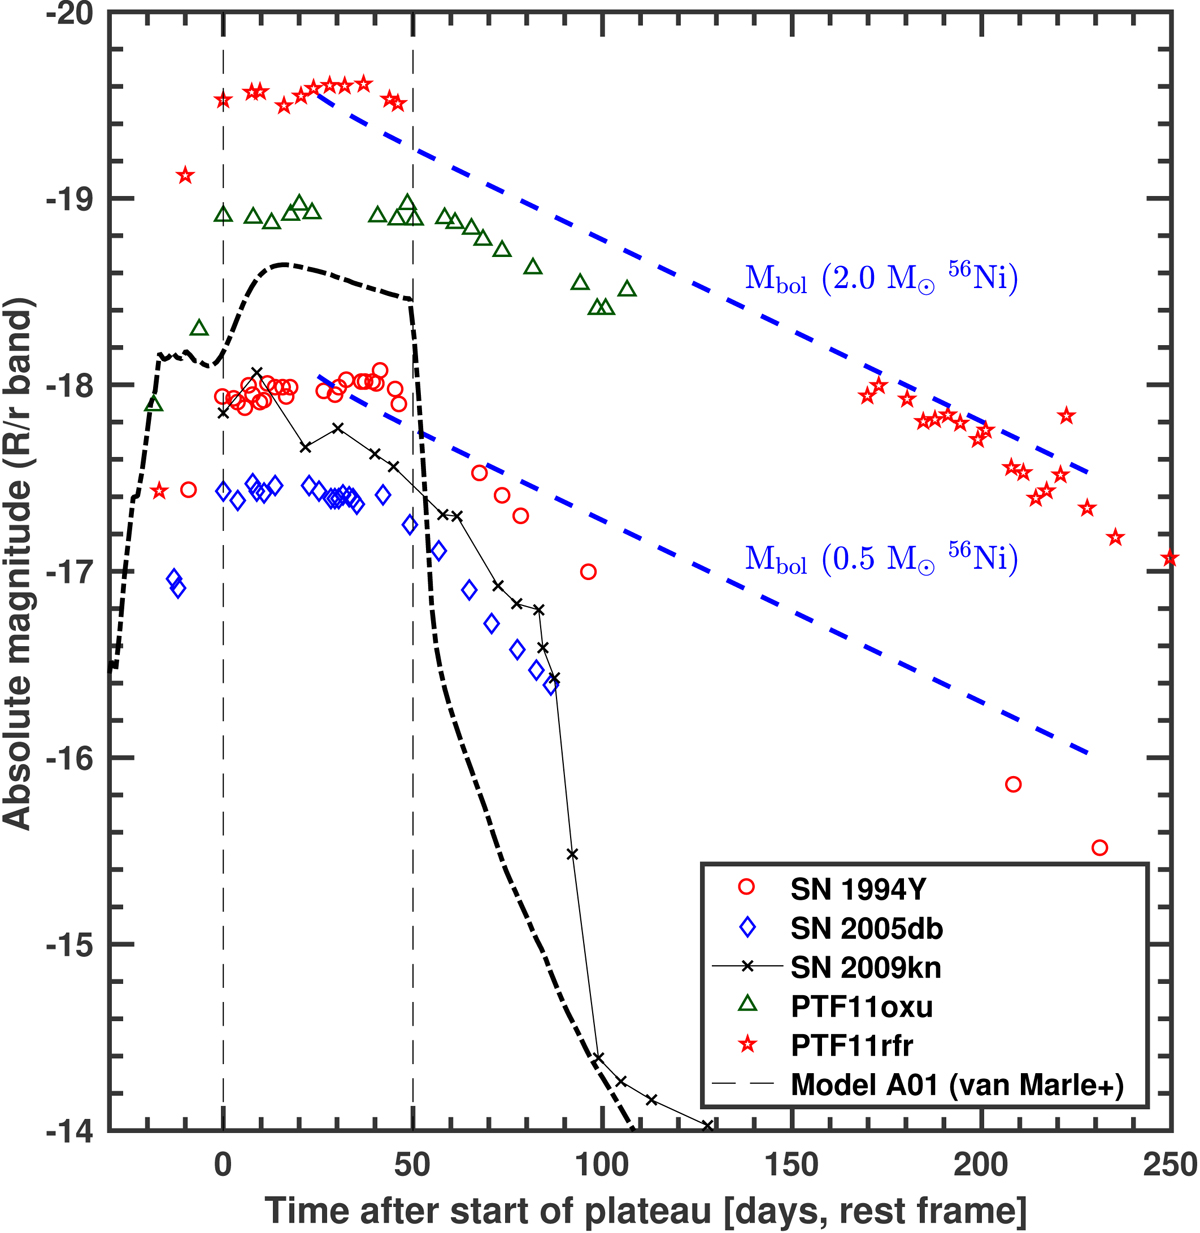
Compilation of SNe IIn with rapid rises, plateau-like maxima, and linear declines. Shown here are the sample SNe PTF11oxu and PTF11rfr (photometry binned in 3 day bins for clarity) along with SNe 1994Y (Ho et al. 2001) and 2005db (Kiewe et al. 2012). For comparison, the Type IIn-P SN 2009kn (Kankare et al. 2012) is shown. Dashed vertical lines highlight 50 d plateau duration. The bolometric decay rates (Nadyozhin 1994) for 0.5 and 2.0 M⊙ of synthesised 56Ni are shown as dashed blue lines (assuming a rise time to plateau start of 20 d) for comparison. They are not fits to the photometry. Model A01 (bolometric luminosity) by van Marle et al. (2010) is also shown.
Current usage metrics show cumulative count of Article Views (full-text article views including HTML views, PDF and ePub downloads, according to the available data) and Abstracts Views on Vision4Press platform.
Data correspond to usage on the plateform after 2015. The current usage metrics is available 48-96 hours after online publication and is updated daily on week days.
Initial download of the metrics may take a while.