Fig. 15.
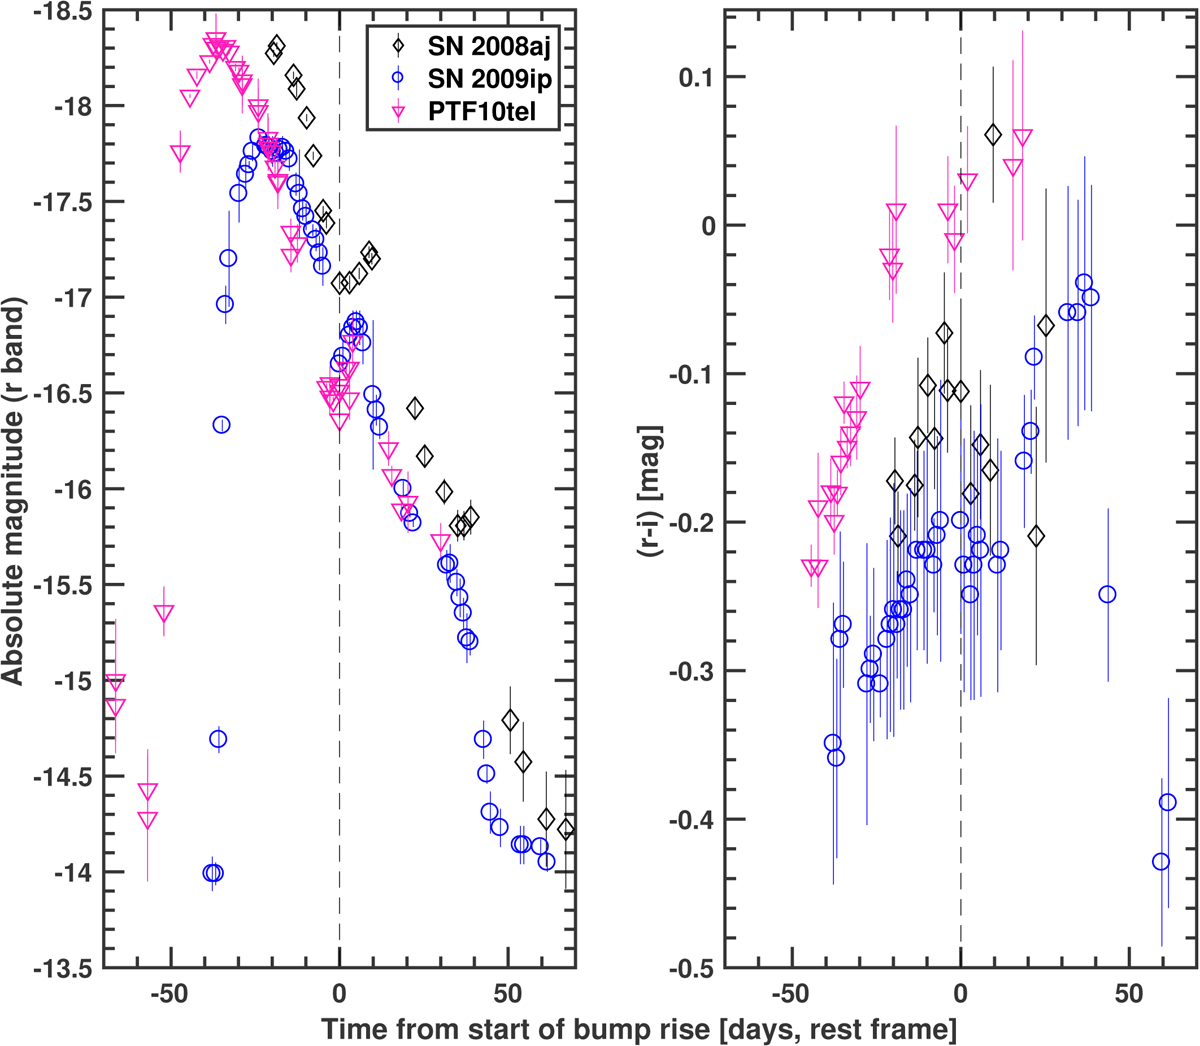
Comparison of the r-band absolute magnitudes and r − i colours for the bumps seen in Type IIn SNe 2008aj, 2009ip (2012B event), and PTF10tel. Photometry and extinction corrections are taken from Hicken et al. (2017), Graham et al. (2014), and this paper, respectively. For clarity, colour data points with uncertainties > 0.1 mag are not shown. The vertical, dashed black line indicates the estimated start epoch of the light curve bumps.
Current usage metrics show cumulative count of Article Views (full-text article views including HTML views, PDF and ePub downloads, according to the available data) and Abstracts Views on Vision4Press platform.
Data correspond to usage on the plateform after 2015. The current usage metrics is available 48-96 hours after online publication and is updated daily on week days.
Initial download of the metrics may take a while.