Fig. 13.
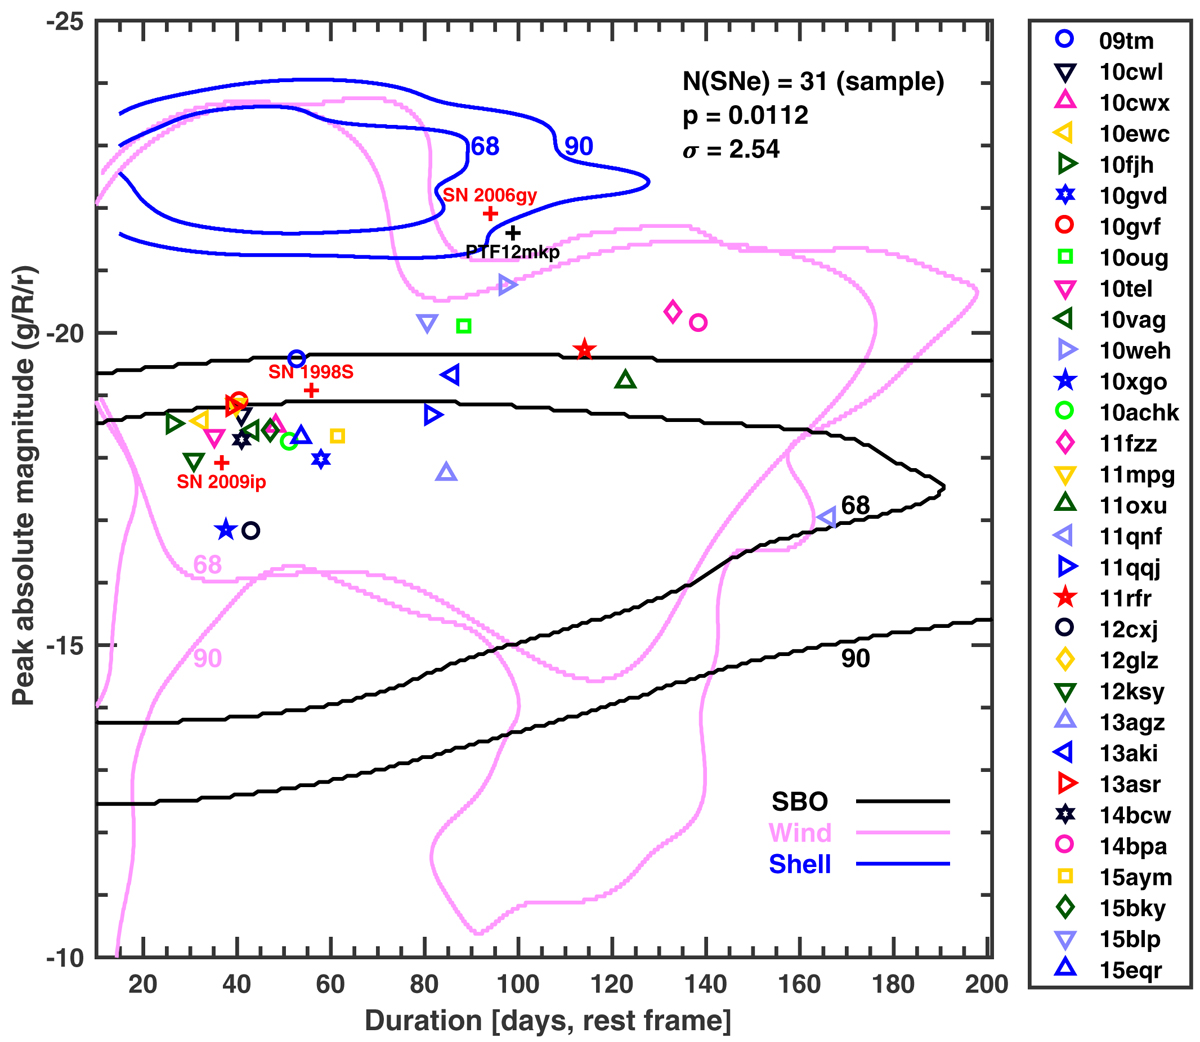
Percentile contours for the DLPS of CSI-driven SNe as explored by Villar et al. (2017) using the MOSFiT code (Guillochon et al. 2018). SN-like events are shown in pink (wind-like CSM) and blue (shell-like CSM) whereas shock-breakout (SBO) transients are shown in black. For each contour colour, the inner contour represents the 68th percentile and the outer contour the 90th percentile. From our sample, 31 SNe are plotted, along with the SLSN IIn PTF12mkp. For comparison, the much-studied SNe 1998S (Liu et al. 2000), 2006gy (Smith et al. 2007), and 2009ip (2012B event, Graham et al. 2014) are included as well. For the N(SNe) = 31 sample SNe, the Spearman correlation coefficient p and the corresponding significance σ are shown.
Current usage metrics show cumulative count of Article Views (full-text article views including HTML views, PDF and ePub downloads, according to the available data) and Abstracts Views on Vision4Press platform.
Data correspond to usage on the plateform after 2015. The current usage metrics is available 48-96 hours after online publication and is updated daily on week days.
Initial download of the metrics may take a while.